Jun 17, 2026·Improving IQ / Preparation
8 Factors That Affect Your IQ Test Results
Do sleep, anxiety, or practice change your IQ score? Discover the 8 scientific factors that affect intelligence. Read the guide and take the RIOT IQ test!
IQ scores are remarkably stable. Across decades of research, professionally developed intelligence tests have proven to be among the most reliable instruments in all of psychology — test-retest reliability coefficients on major IQ tests routinely exceed .90, meaning that the score someone obtains today closely tracks what they would obtain a year from now. That stability is one of the core reasons psychologists take IQ seriously as a predictor of life outcomes.
But stability is not the same as immutability. IQ test performance is a product of both the underlying ability being measured and the conditions surrounding the measurement. Just as a thermometer gives a slightly different reading depending on where it is placed, an IQ test can produce slightly different scores depending on the conditions under which it is taken. Understanding what those conditions are — and how large their effects are — is valuable for anyone who wants to interpret an IQ score accurately.
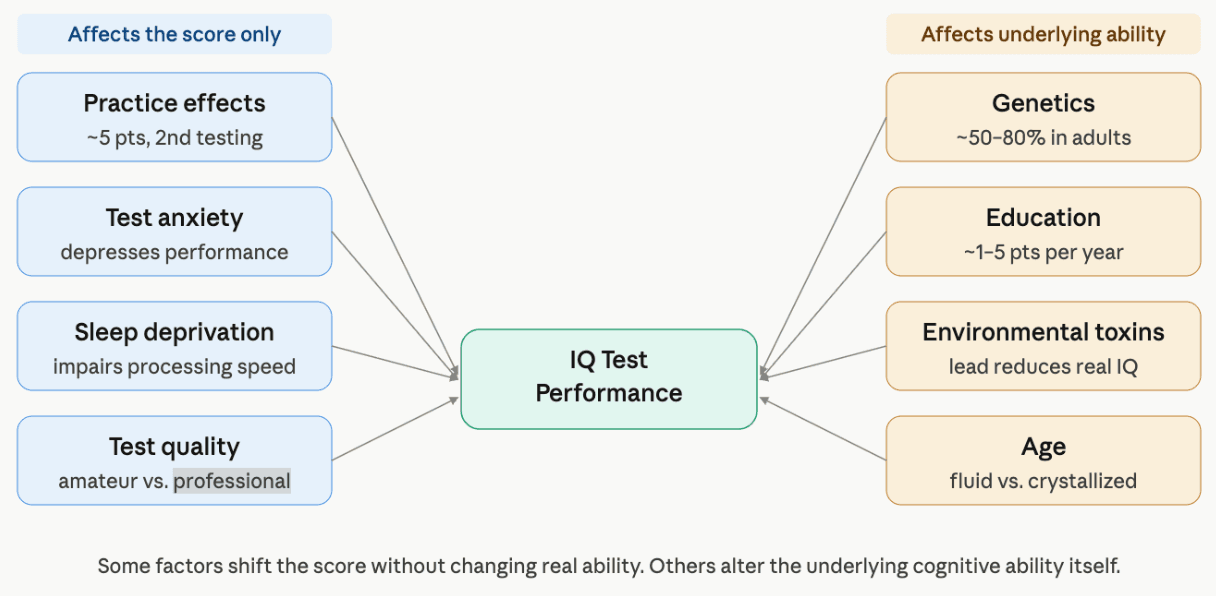
Some of the factors below affect the score by inflating it above a person's true level. Others push it downward. A few affect both IQ as a score and intelligence as the underlying ability. These distinctions matter, and I will be precise about them throughout.
Factor 1: Practice effects and test familiarity
The most immediate and measurable way that IQ scores shift is through repeated exposure to the same test. This is called a "practice effect," and it is one of the most thoroughly documented phenomena in psychometric research.
When a person takes an IQ test for the first time, some portion of their cognitive energy goes toward understanding instructions, deciphering unfamiliar formats, and managing uncertainty about what is expected. On a second testing, that overhead is gone. The examinee already knows what a matrix reasoning item looks like, how the time pressure works, and what kinds of strategies help. Performance improves — not because intelligence has increased, but because the test has become more familiar.
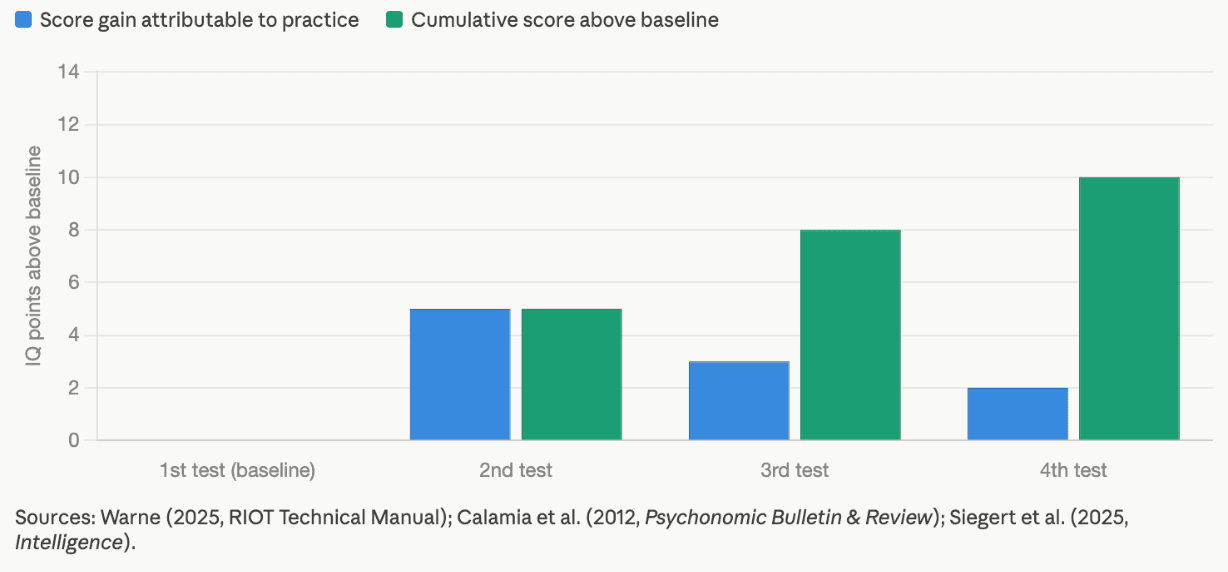
Research I have summarized in my writing on this topic puts the practice effect at roughly 5 IQ points for the second administration of the same test, with an additional 3 points on the third. A broader meta-analysis on cognitive ability retest effects found that memory-based subtests show the largest retest improvements, while creativity-adjacent tasks show the smallest. A more recent study using latent growth curve modeling documented an average linear improvement of about 10 IQ points across multiple test sessions — nearly two thirds of a standard deviation — across different cognitive operations. That is not a trivial inflation.
These score gains are hollow: the number has gone up, but no actual cognitive ability has changed. This is why professional psychologists typically wait at least a year before re-administering the same IQ test to the same examinee, and why tests like the Reasoning and Intelligence Online Test (RIOT) publicly post instruction videos so that test-takers can familiarize themselves with subtest formats before the clock starts — producing a more accurate reading from the first administration.
Factor 2: Test anxiety
Most people feel some degree of nervousness before a high-stakes test. That is normal and, in moderate doses, probably helpful. A mild stress response sharpens focus and motivates effort. But when anxiety becomes excessive — particularly for individuals who experience chronic worry about being evaluated — it can meaningfully suppress performance on an IQ test.
Research on this is nuanced. A 2025 study examining acute stress and IQ performance found that short-term acute stress, on its own, did not significantly reduce scores. However, test anxiety — defined as a trait-level tendency to worry specifically in evaluative situations — was a reliable negative predictor of performance, particularly on performance-based subtests like block design and picture arrangement. Test anxiety appears to compete for the working memory resources that cognitive tasks demand. When mental bandwidth is consumed by intrusive worry, less is available for solving problems.
The magnitude of the effect is meaningful in practice. Research cited by the University of Kansas found that highly anxious students scored nearly 5 points lower than students with average anxiety, even after controlling for prior performance. That gap is the difference between receiving a label of "average" versus "low average" on most IQ score scales.
For examinees who recognize that anxiety affects their testing, the practical implication is straightforward: familiarity with the test format reduces anxiety. The RIOT posts all of its subtest instruction videos publicly on YouTube before testing. The goal is not to allow coaching, but to ensure that a nervous test-taker is not additionally penalized by encountering an unfamiliar task format.
Factor 3: Sleep deprivation
Sleep is not a passive state. During sleep, the brain consolidates learning, clears metabolic waste, and prepares the prefrontal cortex — the seat of executive function — for the next day's demands. When sleep is cut short or disrupted, the cognitive consequences can be observed even on relatively brief tests.
A systematic review published in Sleep Medicine found that sleep duration was significantly associated with full-scale and verbal IQ in school-age children, with longer sleep duration predicting higher scores. An experimental study published in the Journal of Sleep Research made a striking observation: people with higher fluid intelligence actually performed better on cognitive tasks after normal sleep — but showed greater vulnerability to sleep deprivation than those with lower fluid intelligence. The brains working hardest rely most on adequate rest.
The cognitive domains most sensitive to sleep loss are processing speed, working memory, and attention — the same domains measured by many IQ test subtests. Fluid reasoning tasks, which require holding multiple pieces of information in mind simultaneously while applying rules, are particularly affected. Vocabulary and crystallized knowledge tasks are more robust to a single night of poor sleep.
Sleep deprivation is one of the factors that most clearly distorts a score downward, temporarily masking the true level of cognitive ability. For anyone preparing for a professional IQ test, adequate sleep in the nights preceding the assessment is one of the most concrete and effective steps they can take.
Factor 4: Test quality and professional standards
One factor that is rarely discussed in popular writing about IQ is the quality of the test itself. This matters enormously — and the variance in quality across available tests is staggering.
A professionally developed IQ test is built on years of background research, piloted with large samples, screened for biased items, normed on a representative population, and documented in a technical manual. It is designed to meet the Standards for Educational and Psychological Testing established by the American Educational Research Association, the American Psychological Association, and the National Council on Measurement in Education. The internet is filled with tests that produce IQ scores. Most have no technical documentation, no proper norm sample, no item bias screening, and no identified author with verified credentials in psychometrics.
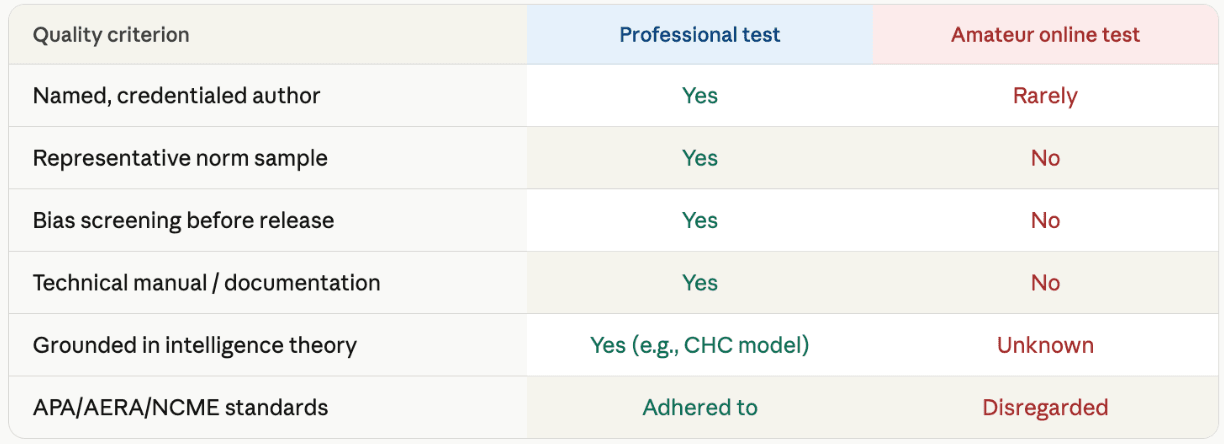
The norm sample question is fundamental. A "norm sample" is the reference group against which all future examinees are compared. When a score is reported as a percentile or an IQ point, that number is derived from how performance compares to the norm group. A norm group of self-selected, highly motivated online test-takers will skew high — making future examinees appear below average even when they are not. A representative national norm sample corrects for this distortion. If a test cannot document who its norm sample is and how it was collected, the scores it produces are not interpretable.
Factor 5: Genetics
Of all the factors covered here, genetics is the most consequential — and the most frequently misunderstood. It does not set a fixed ceiling on intellectual ability. But it does account for a substantial portion of the differences in IQ scores observed between individuals in typical Western environments.
Estimates from twin and adoption studies consistently place the heritability of IQ in adults between 50% and 80%, meaning that genetic differences account for roughly half to four-fifths of the variation in adult IQ scores within a given population. That figure is not fixed across the lifespan — heritability is closer to 40% in young children and rises steadily through adolescence into adulthood. The likely explanation is gene-environment correlation: as individuals gain autonomy, they increasingly select environments that match their genetic tendencies, amplifying genetic differences over time.
These estimates come from comparing identical twins (who share essentially 100% of their DNA) with fraternal twins (who share about 50%), and from studying twins raised apart. When identical twins reared in different families still end up with similar IQ scores, the evidence for a genetic contribution becomes difficult to dismiss.
Heritability is a population-level statistic, not an individual one. It describes what accounts for variation across a population — it says nothing about whether any particular person's intelligence could have been different under different circumstances. High heritability does not mean immutability.
Factor 6: Education
Education is the most clearly established environmental factor that raises IQ scores — and, to some extent, the underlying cognitive ability. The two are related but not identical, which makes this one of the more interesting findings in intelligence research.
A landmark meta-analysis by Ritchie and Tucker-Drob (2018), drawing on 142 effect sizes from 42 datasets involving over 600,000 participants, found consistent evidence that each additional year of education is associated with an IQ gain of approximately 1 to 5 IQ points. The studies used quasi-experimental designs to minimize confounding — controlling for prior IQ, exploiting natural experiments like changes in compulsory schooling laws, and using regression-discontinuity designs at school entry cutoffs. All three approaches pointed in the same direction.
A Norwegian natural experiment involving a compulsory schooling reform in the 1960s strengthened this evidence considerably. When the minimum required years of schooling increased, IQ scores measured at age 19 rose in tandem — a result that strongly implies causation rather than mere correlation.

A separate study examining the structure of educational gains found that improvements did not flow entirely through the general factor g, but instead operated through direct gains on specific cognitive skills — suggesting that the mechanism is partly about developing particular competencies rather than simply boosting general intelligence across the board.
Factor 7: Environmental toxins
Some environmental exposures do not merely affect performance on a test — they alter the brain itself, reducing actual cognitive ability in lasting ways. Lead poisoning is the most extensively documented case.
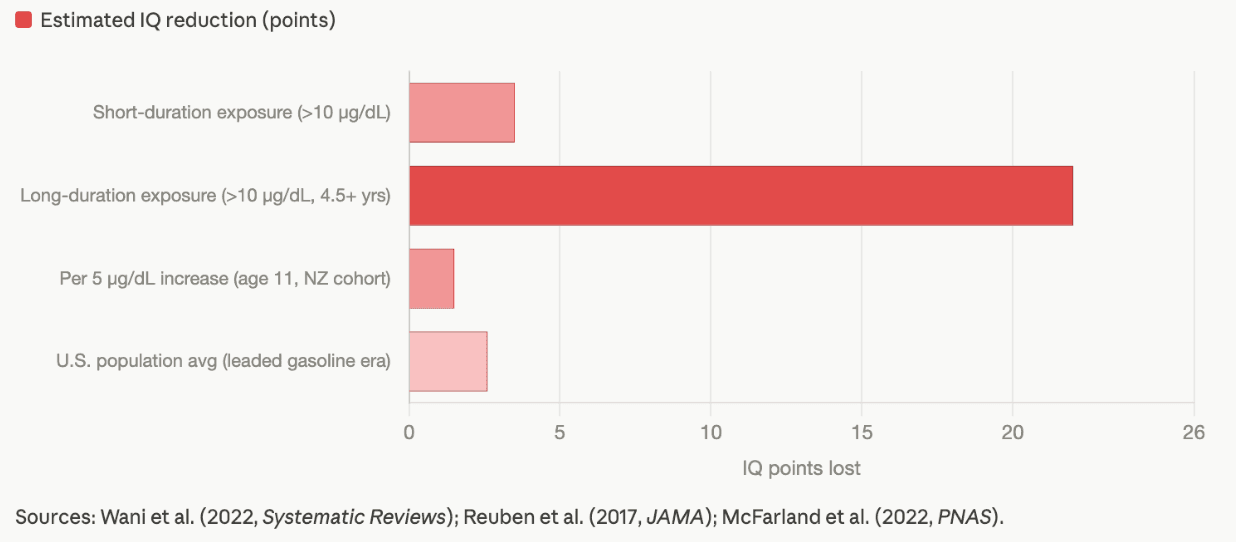
Lead is a neurotoxin with no safe level of exposure. It crosses the blood-brain barrier readily, particularly in developing brains, where it interferes with the neurotransmitter systems responsible for learning, memory, and executive function. A meta-analysis of eight case-control studies involving over 3,300 children found that lead exposure above 10 micrograms per deciliter of blood was associated with IQ reductions of 3.5 to 22 points, depending on the duration of exposure. A longitudinal cohort study from New Zealand found that for every 5-microgram increase in blood lead measured at age 11, a person lost approximately 1.5 IQ points by age 38 — and those IQ losses were associated with measurable declines in social mobility.
The scale of this problem in recent history is sobering. A 2022 analysis estimated that childhood lead exposure from leaded gasoline may have reduced America's collective IQ by an average of 2.6 points per person — totaling over 824 million IQ points lost across more than 170 million Americans who had clinically concerning blood lead levels as children.
Lead is the most studied toxin, but prenatal exposure to alcohol and certain pharmaceutical compounds, as well as traumatic brain injury at any age, are also associated with meaningful and lasting reductions in measured IQ. Unlike anxiety or sleep deprivation, the effects of these exposures cannot be undone by rescheduling the test.
Factor 8: Age and developmental stage
Intelligence does not follow a single developmental trajectory across the lifespan. Different cognitive abilities peak at different times, and the pattern of change matters for understanding what an IQ score means at any particular age.
Fluid intelligence — the capacity to reason through novel problems without relying on learned knowledge — peaks in early adulthood, typically in the mid-20s, and declines gradually thereafter. Processing speed and working memory follow a similar trajectory. Crystallized intelligence — the accumulated store of learned knowledge, vocabulary, and verbal reasoning — is more resilient. It tends to increase or remain stable through middle age and does not typically decline until the very late stages of life (the mid-to-late 80s, on average).
This divergence has a direct consequence for how IQ scores are calculated. Modern IQ tests use deviation IQs, comparing each examinee to their own age group — which controls for these developmental changes. A person who scores 100 at age 25 and 100 at age 65 has performed at the average for their respective age groups on both occasions, even though the absolute level of cognitive functioning behind those scores differs considerably.
Age-related changes also affect which subtests of an IQ battery will most challenge a particular examinee, and how profiles should be interpreted. A 70-year-old who scores high on vocabulary but lower on matrix reasoning may be showing a normal age-related profile — not a sign of impairment. This is why a good IQ battery reports scores across multiple cognitive domains rather than returning only a single composite number.
A note on how these factors interact
These eight factors do not operate in isolation. An examinee who is sleep-deprived and anxious will likely perform further below their true ability than either factor would produce alone. Someone who has taken the same test before may partially compensate for test anxiety through familiarity. A child who grew up in an environment contaminated with lead carries a permanent reduction in the cognitive capacity that education subsequently works to develop.
It is also worth distinguishing which factors operate at the level of the measurement and which operate at the level of the ability itself. Practice effects, test anxiety, sleep deprivation, and test quality primarily affect the accuracy of the score as a reading of underlying ability. Genetics, education, environmental toxins, and age-related changes affect the underlying cognitive ability being measured. Both categories matter for interpretation, but they call for different responses.
Taking a test that accounts for all of this
Understanding what can affect an IQ score is useful for any examinee. It is equally useful for test creators. A professionally developed test is built with these factors in mind — through careful test design, a representative norm sample, transparent technical documentation, and ongoing evaluation.
The Reasoning and Intelligence Online Test (RIOT) is the first online IQ test developed to meet the professional standards established by the APA, AERA, and NCME. Developed by Dr. Russell T. Warne after more than 15 years of intelligence research, the RIOT was normed on a representative sample of the U.S. adult population and reviewed by a panel of experts before release. Its technical manual documents the reliability, validity, and norming procedures in full. Instruction videos for every subtest are publicly available so that examinees can enter the assessment without the disadvantage of format unfamiliarity — reducing the anxiety and practice-effect distortions that this article has described.
References
- Gottfredson, L. S., et al. (1997). Mainstream science on intelligence. Intelligence, 24(1), 13–23. https://doi.org/10.1016/S0160-2896(97)90011-8
- Calamia, M., Markon, K., & Tranel, D. (2012). Scoring higher the second time around: Meta-analyses of practice effects in neuropsychological assessment. The Clinical Neuropsychologist, 26(4), 543–570. https://doi.org/10.1080/13854046.2012.680913
- Karr, J. E., et al. (2018). Retest effects in working memory capacity tests: A meta-analysis. Psychonomic Bulletin & Review, 25(6), 2175–2199. https://doi.org/10.3758/s13423-018-1461-6
- Siegert, M., et al. (2025). Investigating retest effects in cognitive ability tests: An operation-specific approach. Intelligence. https://doi.org/10.1016/j.intell.2025.101900
- Ackerman, P. L. (2005). The impact of anxiety on performance IQ. Anxiety, Stress, & Coping, 18(1). https://doi.org/10.1080/10615800412336436
- Hamilton, N., et al. (2021). Research on the link between test anxiety and poor sleep. International Journal of Behavioral Medicine. https://news.ku.edu/news/article/2021/04/23/research-delves-link-between-test-anxiety-and-poor-sleep
- Scharfen, J., Peters, J. M., & Holling, H. (2023). Intelligence predicts better cognitive performance after normal sleep but larger vulnerability to sleep deprivation. Journal of Sleep Research, 32(4), e13815. https://doi.org/10.1111/jsr.13815
- American Educational Research Association, American Psychological Association, & National Council on Measurement in Education. (2014). Standards for educational and psychological testing. https://www.testingstandards.net/
- Bouchard, T. J., Jr., & McGue, M. (2003). Genetic and environmental influences on human psychological differences. Journal of Neurobiology, 54(1), 4–45. https://doi.org/10.1037/a0035893
- Haworth, C. M. A., et al. (2010). The heritability of general cognitive ability increases linearly from childhood to young adulthood. Molecular Psychiatry, 15(11), 1112–1120. https://pmc.ncbi.nlm.nih.gov/articles/PMC2889158/
- Ritchie, S. J., & Tucker-Drob, E. M. (2018). How much does education improve intelligence? A meta-analysis. Psychological Science, 29(8), 1358–1369. https://doi.org/10.1177/0956797618774253
- Brinch, C. N., & Galloway, T. A. (2012). Schooling in adolescence raises IQ scores. PNAS, 109(2), 425–430. https://doi.org/10.1073/pnas.1106077109
- Wani, A. L., et al. (2022). The effect of lead exposure on IQ test scores in children under 12 years: A systematic review and meta-analysis. Systematic Reviews, 11, 141. https://doi.org/10.1186/s13643-022-01963-y
- Reuben, A., et al. (2017). Association of childhood blood lead levels with cognitive function and socioeconomic status at age 38 years. JAMA, 317(12), 1244–1251. https://doi.org/10.1001/jama.2017.1712
- McFarland, M. J., et al. (2022). Half of US population exposed to adverse lead levels in early childhood. PNAS, 119(11). https://doi.org/10.1073/pnas.2118631119
- Warne, R. T. (2025). Technical manual for the Reasoning and Intelligence Online Test, version 1.0. RIOT IQ.
Take our professional IQ test
Want to know your IQ? Try the first ever professional online IQ test.
Article Categories
All ArticlesUnderstanding IQ ScoresTaking an IQ TestRIOT-Specific InformationGeneral IQ & IntelligenceAdvanced Topics & ResearchIQ Scores & InterpretationMensa & High-IQ SocietiesOnline IQ Tests IQ Test Basics & FundamentalsAverage IQ & DemographicsFamous People & IQHistory & Origins Of IQ TestingAccuracy, Reliability & CriticismSpecial Population & Related ConditionsImproving IQ / PreparationSpecific IQ Tests & FormatsIQ Testing for HR & RecruitmentSkills Assessment
Related Articles
How to Improve Spatial Reasoning Skills Fast7 Everyday Ways You Are Ruining Your IQHow Does Sleep Affect IQ and Cognitive Performance?Can Brain Training Apps Actually Increase IQ?8 Factors That Affect Your IQ Test ResultsWhat Is the Practice Effect on an IQ Test?How Long Does an IQ Test Take? What to Expect Before You StartThe Ultimate Guide to Online IQ Tests: What You Need to Know10 Tips for Achieving a High Score on an IQ TestHow to Prepare for an IQ TestHow Do You Practice for the ASVAB Test?Can You Increase IQ?Can You Study for an IQ Test?How to Improve IQ
Take our IQ testsCompare all tests
Basic IQ Test
5 subtests + 5 cognitive abilities
Features
- ~13 Minutes
- IQ score
- Cognitive abilities breakdown
- ±5.6 IQ margin of error
5/15 Subtests
Learn moreVocabulary
Matrix Reasoning
SToVeS
Visual Reversal
Symbol Search
Full IQ Test
15 subtests + all cognitive abilities
Features
- ~52 Minutes
- IQ score
- Cognitive abilities breakdown
- ±3.7 IQ margin of error
15/15 Subtests
Learn moreVocabulary, Information, Analogies
Matrix Reasoning, Visual Puzzles, Figure Weights
Object Rotation, SToVeS, Spatial Orientation
Computation Span, Exposure Memory, Visual Reversal
Symbol Search, Abstract Matching
Simple Reaction Time, Choice Reaction Time
Community
Intelligence Journals & Organizations
Our Articles