May 5, 2026·Understanding IQ Scores
Understanding IQ Test Results: A Comprehensive Guide
Confused by your score? Learn exactly what an IQ score means, how the bell curve works, and what it predicts. Read our comprehensive guide to learn more!
IQ scores generate more confusion than almost any other number in psychology. People receive a score, see a label like "High Average" or "Superior," and often walk away with only a surface-level understanding of what that number actually means. That is understandable, but IQ scores are not like school grades, and interpreting them correctly requires background knowledge that most people never receive.
This guide is meant to close that gap. Whether someone has just received their first IQ score or has been curious about scores they received years ago, the goal is the same: to explain what the numbers mean, how they are derived, what they reliably predict, and where their limits lie. Every claim made here is grounded in peer-reviewed research.
What an IQ score actually is
An IQ score is not a percentage. It is not the number of questions answered correctly. It is a standardized, relative measure that describes how a person's performance on a cognitive test compares to others in the same age group.
The term "IQ" originally stood for "intelligence quotient," referencing the early 20th-century formula: mental age divided by chronological age, multiplied by 100. That formula is long obsolete. Every modern IQ test uses a "deviation IQ," which places scores on a standardized scale with a mean of 100 and a standard deviation of 15 — making scores interpretable across different ages in a way the old quotient formula could not.
The key phrase is relative measure. An IQ of 115 does not mean the person answered 115% of questions correctly. (A score of 115 actually means that person performed better than approximately 84% of others in their age group.) The score only carries meaning in relation to a comparison group — and the quality of that comparison group, called the "norm sample," is one of the most important things to evaluate when assessing any IQ test.
 The bell curve shape emerges from the fact that intelligence is influenced by a large number of independent variables — genetic variants, environmental factors, developmental differences — and when many such influences combine, the resulting distribution approximates normality. Under this distribution, 68% of individuals score between 85 and 115, and 95% fall between 70 and 130. Scores beyond 130 or below 70 are genuinely rare, each representing roughly 2.3% of the population.
The bell curve shape emerges from the fact that intelligence is influenced by a large number of independent variables — genetic variants, environmental factors, developmental differences — and when many such influences combine, the resulting distribution approximates normality. Under this distribution, 68% of individuals score between 85 and 115, and 95% fall between 70 and 130. Scores beyond 130 or below 70 are genuinely rare, each representing roughly 2.3% of the population.How the deviation IQ is calculated
When a person takes an IQ test, their raw score is compared to the performance of the norm sample — the representative group whose data was collected during the test's development. The comparison produces a number of standard deviations above or below the sample's mean. That value is then transformed to fit the IQ scale (mean = 100, SD = 15). A person who scores exactly at the mean of their age group receives an IQ of 100. One standard deviation above yields 115. Two standard deviations above yields 130.
This 100/15 convention has remained stable for decades across virtually all professionally developed tests, which makes cross-test comparisons meaningful when interpreting scores from different instruments or different time periods.
What the score ranges mean in practice
The labels assigned to IQ ranges have changed multiple times. Terms like "moron," "imbecile," and "idiot" were once scientific labels that were later replaced by less stigmatizing language. The Wechsler tests — the most widely used individually administered IQ batteries in clinical practice — currently use a system running from "Extremely Low" to "Extremely High." These labels describe where a score falls relative to the norm group. They are not diagnoses.
A few empirical reference points are worth anchoring. An IQ of approximately 70–75 marks the threshold for an intellectual disability, the level at which independent living becomes markedly difficult. Around 80–85 is roughly the minimum associated with stable employment in a complex modern society. Most professional positions requiring advanced training carry a minimum IQ of 100-115. These are population-level regularities drawn from occupational research, not rigid cutoffs, and none of them determine any individual's trajectory.
The role of subtests and index scores
A single overall IQ — called the Full Scale IQ or composite IQ — summarizes a great deal but hides detail. Every well-constructed IQ battery is composed of multiple subtests that consist of different cognitive tasks. When those subtest scores are combined, the result is the overall IQ. But the subtest scores, and the index scores derived from them, often tell a more complete story.
Most modern tests are organized according to the Cattell-Horn-Carroll (CHC) theory, which places a general factor (g) at the top of a hierarchy of cognitive abilities. Below g, the model identifies broad abilities — fluid reasoning, crystallized knowledge, visual-spatial processing, working memory, and processing speed — each composed of narrower skills.
What IQ scores predict
IQ is one of the most robust predictors in all of behavioral science. The correlations between IQ and important life outcomes have been replicated hundreds of times across different countries, populations, and time periods.
Academic performance is the most well-documented domain. A large meta-analysis of cognitive ability and school grades found correlations in the range of r = .50 to .60 — strong by social science standards. At the college level, performance on admissions tests like the SAT correlates with IQ strongly enough that the scores can be converted to IQ equivalents.
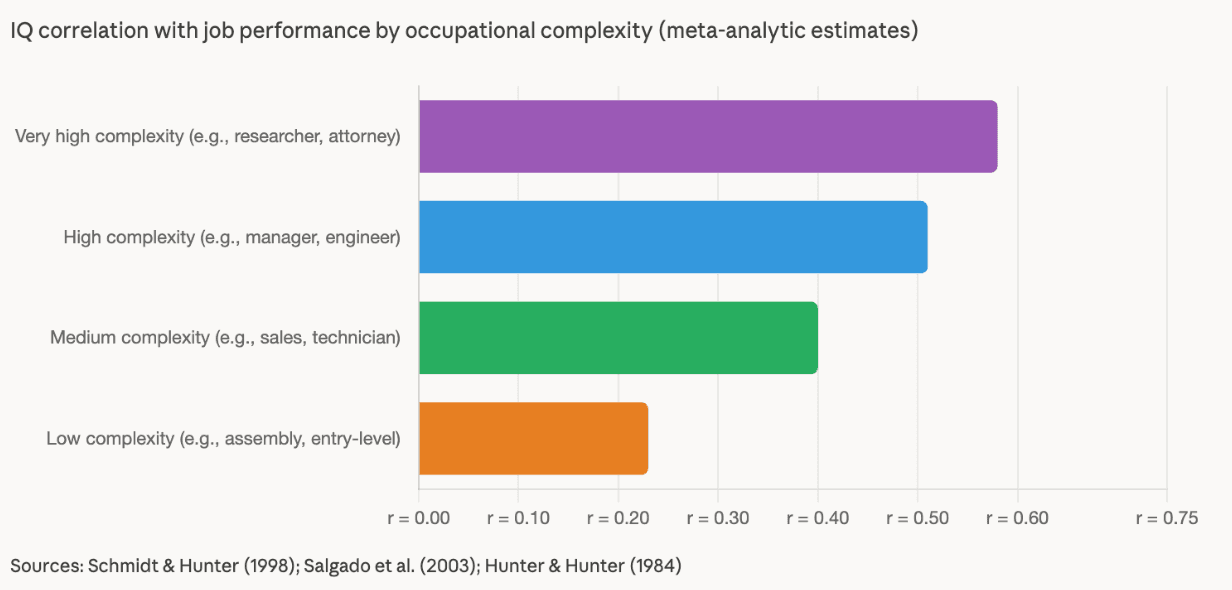
Job performance is another domain with extensive evidence. A landmark meta-analysis found that general mental ability is the single best predictor of job performance across occupational categories, with correlations reaching r = .51 for training success and up to r = .58 for high-complexity roles. IQ outperforms work experience, structured interviews, and reference checks as a hiring predictor — a finding that consistently surprises people.
Deary and colleagues documented that higher childhood IQ is associated with lower rates of heart disease, stroke, accidents, and several cancers in adulthood — effects that persist after controlling for socioeconomic status. The proposed mechanisms include better health literacy and more effective decision-making around health behaviors. Strenze's meta-analysis found that IQ correlates approximately r = .23 with income, with evidence suggesting the relationship is at least partly causal.
None of these correlations are deterministic. A correlation of r = .50 means IQ accounts for roughly 25% of the variance in that outcome — real and consequential, but leaving most variability explained by other factors. IQ is a tailwind, not a guarantee.
Measurement error and confidence intervals
Every IQ score contains measurement error. This is a mathematical inevitability, not a flaw. Any measurement instrument produces scores that fluctuate around the person's "true score" due to random factors: test-day variability in attention, ambient conditions, or the specific items selected.
The standard error of measurement (SEM) captures this random variation. The SEM is used to calculate a confidence interval around the person’s IQ score. For most professionally developed IQ tests, the confidence interval is plus or minus 3 to 5 IQ points.
A 3-point difference between two test administrations, or a 5-point difference between two different tests, may fall entirely within the bounds of measurement error and should not be over-interpreted. Reputable tests report SEM values and/or confidence intervals in their technical documentation, and good score reports present confidence intervals rather than a single number treated as though it were exact.
Score differences between subtests: profile analysis
One of the more nuanced aspects of score interpretation is whether differences between index scores are meaningful. The appeal is intuitive: if someone scores 130 on verbal reasoning but 95 on processing speed, that pattern seems worth examining. And sometimes it is — profiles of strengths and weaknesses can provide insights into a person’s strengths and weaknesses.
The caution is that score variability is common even in neurologically typical individuals. Research by Watkins and Glutting demonstrated that profile "scatter" — the gap between an individual's highest and lowest subtest scores — does not reliably predict academic or occupational outcomes beyond what the overall score already captures. Large discrepancies between index scores are not rare in the general population, which makes it difficult to draw firm conclusions from any single pattern without corroborating evidence.
Whether a profile is clinically meaningful depends on the magnitude of the discrepancy, whether there are corroborating behavioral observations, and whether the individual reports difficulties that align with the weaker areas. The profile alone is not sufficient to draw conclusions.
IQ across the lifespan: how scores change with age
In relative terms — how a person ranks compared to age peers — IQ scores are quite stable. A Scottish cohort study following individuals from age 11 to age 77 found a correlation of r = .63 between childhood and late-adulthood IQ — evidence of substantial rank-order stability across more than six decades.
In absolute terms, the picture is more nuanced. Different cognitive abilities age at markedly different rates. Fluid reasoning peaks in early adulthood and declines relatively early. Crystallized knowledge remains stable or improves into the 60s. Processing speed declines steadily from early adulthood onward, and working memory follows an intermediate trajectory.

This differential aging pattern is why deviation IQs compare examinees to same-age peers. A 70-year-old with an IQ of 100 is performing at the median for their age group — which, in absolute cognitive terms, represents a different level of performance than a 25-year-old with the same score. That normative comparison is informative for most purposes; for tracking change within an individual over time, it requires more careful interpretation.
This differential aging pattern is why deviation IQs compare examinees to same-age peers. A 70-year-old with an IQ of 100 is performing at the median for their age group — which, in absolute cognitive terms, represents a different level of performance than a 25-year-old with the same score. That normative comparison is informative for most purposes; for tracking change within an individual over time, it requires more careful interpretation.
The heritability of IQ and its limits
Heritability is a population-level statistic estimating the proportion of individual differences in a trait associated with genetic differences in a given population and environment. By itself, it does not reveal whether a trait can be changed (a common and important misunderstanding).
Most research in high-income, non-neglectful environments places the heritability of IQ at approximately .50 to .60. Tucker-Drob and Bates documented in a large meta-analysis that heritability increases across development, being lower in young children and higher in adults.
 Environmental influences on IQ are real. Adoption studies show IQ gains of approximately 3 points when children are raised in more enriched environments. Education raises IQ by roughly 1–2 points per additional year of schooling in high-quality research designs. Exposure to environmental toxins such as lead depresses IQ reliably. Genes and environment both matter — their relative contributions simply differ across populations and developmental periods.
Environmental influences on IQ are real. Adoption studies show IQ gains of approximately 3 points when children are raised in more enriched environments. Education raises IQ by roughly 1–2 points per additional year of schooling in high-quality research designs. Exposure to environmental toxins such as lead depresses IQ reliably. Genes and environment both matter — their relative contributions simply differ across populations and developmental periods.How IQ relates to school and work performance
In school settings, IQ's correlation with GPA has been estimated at approximately r = .50 across multiple countries and educational levels. Standardized achievement tests show even higher correlations with IQ, often reaching r = .70 or above — unsurprising given that achievement tests measure accumulated knowledge that partly reflects prior cognitive engagement.
In the workplace, the relationship depends on occupational complexity, and the research holds across different countries, measurement approaches, and decades. One important nuance is that predictive validity improves when IQ is combined with other measures. High school GPA plus SAT scores predict college performance better than either alone; IQ combined with conscientiousness or structured interviews outperforms any single predictor in employment contexts.
The limits of any single score
IQ tests are among the most carefully developed and thoroughly validated instruments in psychology. Even so, they have limits worth understanding.
First, IQ captures a sample of cognitive performance on a specific day under specific conditions. Test-day factors — illness, stress, sleep deprivation — can depress scores without reflecting the person's typical functioning. Most test developers provide guidance on conditions that make an administration unreliable, and good practice involves retesting when there is reason to believe a session was compromised.
Second, IQ does not capture all cognitively relevant abilities. The g factor is broad but not the totality of cognition. Specific abilities like spatial visualization, vocabulary depth, or processing speed can matter in particular domains beyond what the overall score captures — which is why IQ test batteries report index scores alongside the composite.
Third, IQ does not capture non-cognitive characteristics that are also consequential. Conscientiousness, self-discipline, and the ability to form productive relationships matter enormously in school and work. Research by Heckman and colleagues has documented that non-cognitive traits are significant predictors of labor market outcomes above and beyond cognitive ability.
 General mental ability is among the best single predictors of job performance — competitive with work sample tests and structured interviews. The more productive framing for IQ interpretation is not "how smart is this person?" as a final verdict, but rather: what does this number tell us, and what else do we need to know?
General mental ability is among the best single predictors of job performance — competitive with work sample tests and structured interviews. The more productive framing for IQ interpretation is not "how smart is this person?" as a final verdict, but rather: what does this number tell us, and what else do we need to know?A note on the test used to obtain the score
The interpretation of any IQ score is only as valid as the test that produced it. Professional IQ tests are designed by experts in psychometrics and go through extensive piloting, bias review, and norming before release. The Standards for Educational and Psychological Testing spell out what test creators are expected to do in their work.
Many tests available online do not meet these standards. Some are created by developers with no formal training in psychometrics. Others use self-selected norm samples rather than representative ones — which means the "comparison group" is not the general population but whoever happened to seek out and take the test. A score from such a test is not a valid IQ score in any scientifically meaningful sense.
The Reasoning and Intelligence Online Test (RIOT) is the first online IQ test developed to meet the professional standards applied to traditional, clinician-administered tests. It was created by a published intelligence researcher with more than 15 years of experience in the field, underwent expert panel review, and was normed on a representative U.S. sample — the first online IQ test to achieve this. A score from the RIOT can be interpreted using all of the principles described in this article.
Interpreting a score responsibly
When a score arrives, several principles are worth keeping in mind. The score is a relative ranking, not an absolute quantity — it describes where the examinee falls within a distribution of same-age peers. The precise number is only as important than the range of the confidence interval around it.
The overall IQ is a starting point, not a complete picture. Index scores, subtest patterns, and the context of the administration all contribute to a fuller understanding. IQ is also one variable among many that shape life outcomes — a probabilistic predictor that describes tendencies across populations rather than certainties for individuals. Personality, motivation, social context, educational opportunity, and choices made over time all interact with cognitive ability to produce the outcomes that matter most.
If a score raises questions — especially in clinical or educational contexts — those questions are worth discussing with a qualified professional who can interpret the full assessment and its surrounding circumstances. IQ scores are scientific instruments, and like all instruments, they are most useful in the hands of someone who understands both their power and their limits.
References
- Carroll, J. B. (1993). Human cognitive abilities: A survey of factor-analytic studies. Cambridge University Press. https://doi.org/10.1017/CBO9780511571312
- Gottfredson, L. S., et al. (1997). Mainstream science on intelligence. Intelligence, 24(1), 13–23. https://doi.org/10.1016/S0160-2896(97)90011-8
- Schmidt, F. L., & Hunter, J. E. (1998). The validity and utility of selection methods in personnel psychology. Psychological Bulletin, 124(2), 262–274. https://doi.org/10.1037/0033-2909.124.2.262
- Schmidt, F. L., & Hunter, J. (1998). General mental ability in the world of work. Journal of Applied Psychology, 83(6), 869–877. https://doi.org/10.1037/0021-9010.83.6.869
- Roth, B., et al. (2019). Intelligence and school grades: A meta-analysis. Journal of School Psychology, 53, 118–137. https://doi.org/10.1016/j.jsp.2018.10.001
- Deary, I. J., Weiss, A., & Batty, G. D. (2010). Intelligence and personality as predictors of illness and death. Psychological Science in the Public Interest, 11(2), 53–79. https://doi.org/10.1111/j.0963-7214.2004.01301001.x
- Whalley, L. J., & Deary, I. J. (2001). Longitudinal cohort study of childhood IQ and survival up to age 76. BMJ, 322(7280), 819. https://doi.org/10.1136/bmj.322.7280.819
- Strenze, T. (2007). Intelligence and socioeconomic success: A meta-analytic review. Intelligence, 35(5), 401–426. https://doi.org/10.1016/j.intell.2006.09.004
- Tucker-Drob, E. M., & Bates, T. C. (2016). Large cross-national differences in gene × socioeconomic status interaction on intelligence. Psychological Science, 27(2), 138–149. https://doi.org/10.1037/a0035893
- Ritchie, S. J., & Tucker-Drob, E. M. (2018). How much does education improve intelligence? A meta-analysis. Psychological Science, 29(8), 1358–1369. https://doi.org/10.1177/0956797618774253
- van IJzendoorn, M. H., et al. (2005). IQ of children growing up in children's homes. Merrill-Palmer Quarterly, 51(3), 341–360. https://doi.org/10.1073/pnas.1417106112
- Watkins, M. W., & Glutting, J. J. (2001). Incremental validity of WISC-III profile elevation, scatter, and shape. Psychology in the Schools, 38(4), 297–309. https://doi.org/10.1177/07342829010190020
- Horn, J. L., & Cattell, R. B. (1967). Age differences in fluid and crystallized intelligence. Acta Psychologica, 26, 107–129. https://doi.org/10.1016/0001-6918(67)90011-X
- Salthouse, T. A. (2010). Selective review of cognitive aging. Journal of the International Neuropsychological Society, 16(5), 754–760. https://doi.org/10.1017/S1355617710000706
- Jensen, A. R. (1998). The g factor: The science of mental ability. Praeger. https://doi.org/10.1017/9781316273203
- Heckman, J. J., Stixrud, J., & Urzua, S. (2006). The effects of cognitive and noncognitive abilities on labor market outcomes. Journal of Political Economy, 114(3), 411–482. https://doi.org/10.1257/jep.20.4.47
- Salgado, J. F., et al. (2003). A meta-analytic study of general mental ability validity for different occupations in the European Community. Journal of Applied Psychology, 88(6), 1068–1081. https://doi.org/10.1080/08959285.2002.9668091
- Deary, I. J., et al. (2007). Intelligence and educational achievement. Intelligence, 35(1), 13–21. https://doi.org/10.1016/j.intell.2006.02.001
- Warne, R. T. (2025). Technical manual for the Reasoning and Intelligence Online Test, version 1.0. RIOT IQ. https://riotiq.com
American Educational Research Association, APA, & NCME. (2014). Standards for educational and psychological testing.https://www.testingstandards.net/
Take our professional IQ test
Want to know your IQ? Try the first ever professional online IQ test.
Article Categories
All ArticlesUnderstanding IQ ScoresTaking an IQ TestRIOT-Specific InformationGeneral IQ & IntelligenceAdvanced Topics & ResearchIQ Scores & InterpretationMensa & High-IQ SocietiesOnline IQ Tests IQ Test Basics & FundamentalsAverage IQ & DemographicsFamous People & IQHistory & Origins Of IQ TestingAccuracy, Reliability & CriticismSpecial Population & Related ConditionsImproving IQ / PreparationSpecific IQ Tests & FormatsIQ Testing for HR & RecruitmentSkills Assessment
Related Articles
How Do People With High IQ Behave?IQ vs. Creativity: Does a High IQ Make a Person More Creative?Can a Person Have a High IQ and Low Emotional Intelligence?How to Interpret IQ Test ResultsRaw Score vs. Scaled Score on an IQ TestUnderstanding IQ Test Results: A Comprehensive GuideHow Do I Know My IQ Level?Why did my IQ score change?Measurement and IQ Score PropertiesAre Intelligence Tests Perfect?Are Intelligence Tests' Contents Trivial?The Impact of Motivation on IQ: Going… Going… (almost) GoneHow To Calculate IQThe Complete Guide to IQ Score CalculationImportance of a High IQHigh Giftedness and PersonalityHigh GiftednessIQ Scores and Differences Between GroupsInterpretation of an IQ Score
Take our IQ testsCompare all tests
Basic IQ Test
5 subtests + 5 cognitive abilities
Features
- ~13 Minutes
- IQ score
- Cognitive abilities breakdown
- ±5.6 IQ margin of error
5/15 Subtests
Learn moreVocabulary
Matrix Reasoning
SToVeS
Visual Reversal
Symbol Search
Full IQ Test
15 subtests + all cognitive abilities
Features
- ~52 Minutes
- IQ score
- Cognitive abilities breakdown
- ±3.7 IQ margin of error
15/15 Subtests
Learn moreVocabulary, Information, Analogies
Matrix Reasoning, Visual Puzzles, Figure Weights
Object Rotation, SToVeS, Spatial Orientation
Computation Span, Exposure Memory, Visual Reversal
Symbol Search, Abstract Matching
Simple Reaction Time, Choice Reaction Time
Community
Intelligence Journals & Organizations
Our Articles