Nov 14, 2025·IQ Scores & Interpretation
What is the IQ Scale/Range?
What is the IQ scale? Discover the IQ range (avg 100, SD 15), normal IQ ranges from 70-130 (95%), and what IQ ranges mean on the chart.
IQ scores are often misunderstood because they don't work like most test scores people are familiar with. If someone says that they scored an 85 on an IQ test, that doesn't mean they answered 85% of the questions correctly. Instead, IQ scores use a specific scale that compares a person's performance to others in their age group.
The Standard IQ Scale
Most modern IQ tests use a scale where 100 is set as the average score, with a standard deviation of 15 points. This standardized scale has been in use since the mid-20th century and is used by virtually all professionally developed IQ tests today, including the Wechsler tests, Stanford-Binet, and the Reasoning and Intelligence Online Test (RIOT).
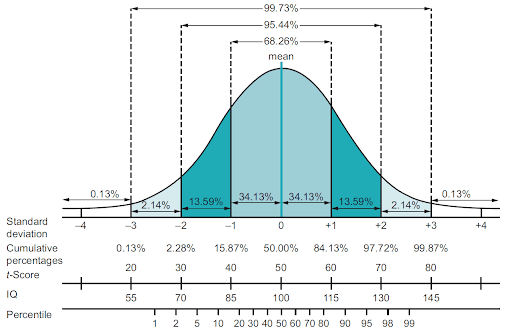
The standard deviation is a statistical measure of how spread out the scores are from the average. With a standard deviation of 15, this means:
• 68% of people score between 85 and 115 (within one standard deviation of the average)
• 95% of people score between 70 and 130 (within two standard deviations)
• 99.7% of people score between 55 and 145 (within three standard deviations)
The further a score is from 100, the rarer it becomes. A score of 130 or higher is achieved by only about 2% of the population, while a score of 145 or higher is obtained by less than 0.15% of people.
Understanding IQ Ranges and Labels
For over a century, psychologists have created labels for different IQ ranges to help people understand what scores mean. However, these labels are arbitrary, and they vary over time and from test to test. The table below shows score labels that the RIOT uses:
Score Range | Label | Expected Percentage of the Population |
< 74 | Questionable Score | 4% |
75-80 | Foundational Score | 5% |
81-90 | Approaching Average Score | 16% |
91-99 | Average Score | 25% |
100-109 | Average Score | 25% |
110-120 | Above Average Score | 16% |
121-135 | Significantly Above Average Score | 8% |
136+ | Far Above Average Score | 1% |
The fact that these labels have changed tells us an important point: the labels themselves are less important than the actual score. What matters is understanding what the score indicates about a person's cognitive abilities relative to their peers.
More importantly, it is the score receiving the label, and not the person. Someone might score in the "high average" range, but that doesn't make them a "high average person." People are much more than a single number.
Why IQ Uses This Scale
The IQ scale is based on what statisticians call a "normal distribution" (sometimes informally called a "bell curve"). When large groups of people take an IQ test, their scores naturally form this bell-shaped pattern, with most people scoring near the middle and fewer people at the extremes.
This distribution pattern appears consistently across different populations and different tests, which is part of what makes IQ scores so useful for comparison. Research has shown that this pattern holds true across cultures and time periods, though average performance has shifted over the decades (a phenomenon known as the Flynn effect).
The choice of 100 as the average and 15 as the standard deviation is convenient but ultimately arbitrary. A few tests use different scales. For example, some tests use a standard deviation of 16 instead of 15. When comparing scores across tests, it's important to know which scale was used. The SAT and ACT, which correlate strongly with IQ, use entirely different scales but can be converted to IQ scores.
Relative vs. Absolute Measurement
One important aspect of the IQ scale is that it provides relative comparisons, not absolute ones. An IQ score states how well someone performed compared to other people in their age group. It does not measure cognitive ability in absolute terms.
This distinction matters most when thinking about children. An 8-year-old with an IQ of 100 and a 16-year-old with an IQ of 100 both performed at the average level for their respective ages. But the 16-year-old obviously has far more impressive cognitive abilities in absolute terms; they can handle more complex problems, have more knowledge, and can reason at a more sophisticated level. The IQ score of 100 simply indicates that both children are performing as well as the typical person their age.
Take our professional IQ test
Want to know your IQ? Try the first ever professional online IQ test.
Article Categories
All ArticlesUnderstanding IQ ScoresTaking an IQ TestRIOT-Specific InformationGeneral IQ & IntelligenceAdvanced Topics & ResearchIQ Scores & InterpretationMensa & High-IQ SocietiesOnline IQ Tests IQ Test Basics & FundamentalsAverage IQ & DemographicsFamous People & IQHistory & Origins Of IQ TestingAccuracy, Reliability & CriticismSpecial Population & Related ConditionsImproving IQ / PreparationSpecific IQ Tests & FormatsIQ Testing for HR & RecruitmentSkills Assessment
Related Articles
What Is the Difference Between IQ and Emotional Intelligence?IQ vs. EQ: Which One Matters More for Career Success?What Is a Ceiling Effect on an IQ Test?What Is a Norm Group in IQ Testing?What Is Full Scale IQ? How to Read the Overall ScoreIs 145 a High IQ Score?What Is a 'Good' IQ Score?Understanding IQ Score Scales: A Complete GuideIs a 120 IQ Considered Gifted?What Is the Dumbest IQ Score?Is an IQ of 170 considered a genius?Is My IQ Score Good?What is a Good IQ Score?What is Considered a High IQ?Understanding Your Free IQ Test Results in 2026Why is 100 the Average IQ?Does IQ Change With Age?What Does an IQ of X Mean?Does IQ Matter?What is the IQ Scale/Range?What is the Highest Possible IQ?What is a Genius IQ Score?Is a 97 IQ considered dumb?
Take our IQ testsCompare all tests
Basic IQ Test
5 subtests + 5 cognitive abilities
Features
- ~13 Minutes
- IQ score
- Cognitive abilities breakdown
- ±5.6 IQ margin of error
5/15 Subtests
Learn moreVocabulary
Matrix Reasoning
SToVeS
Visual Reversal
Symbol Search
Full IQ Test
15 subtests + all cognitive abilities
Features
- ~52 Minutes
- IQ score
- Cognitive abilities breakdown
- ±3.7 IQ margin of error
15/15 Subtests
Learn moreVocabulary, Information, Analogies
Matrix Reasoning, Visual Puzzles, Figure Weights
Object Rotation, SToVeS, Spatial Orientation
Computation Span, Exposure Memory, Visual Reversal
Symbol Search, Abstract Matching
Simple Reaction Time, Choice Reaction Time
Community
Intelligence Journals & Organizations
News & Press
Our Articles
Our Articles
Our Articles
Our Articles
Our Articles