What Is the Average IQ by State? (And Why the Rankings Are Estimates)
What is the average IQ by state? See the McDaniel 2006 estimates, the updated 2022 numbers, and why every state IQ ranking is a proxy, not a real IQ test.
Dr. Russell T. WarneChief Scientist
Share
Every US state's estimated average IQ falls between roughly 94 and 104 on a scale where 100 is the national average. The best-known figures, from McDaniel (2006) and an updated 2022 study by Pesta, put Massachusetts and New Hampshire at the top and Mississippi, Louisiana, and New Mexico near the bottom. One caveat belongs in the first breath: no state administers real IQ tests to representative samples of its residents. Every ranking you will find is an estimate converted from school achievement scores, and the entire 50-state spread covers only about 10 points.
What the state IQ rankings show
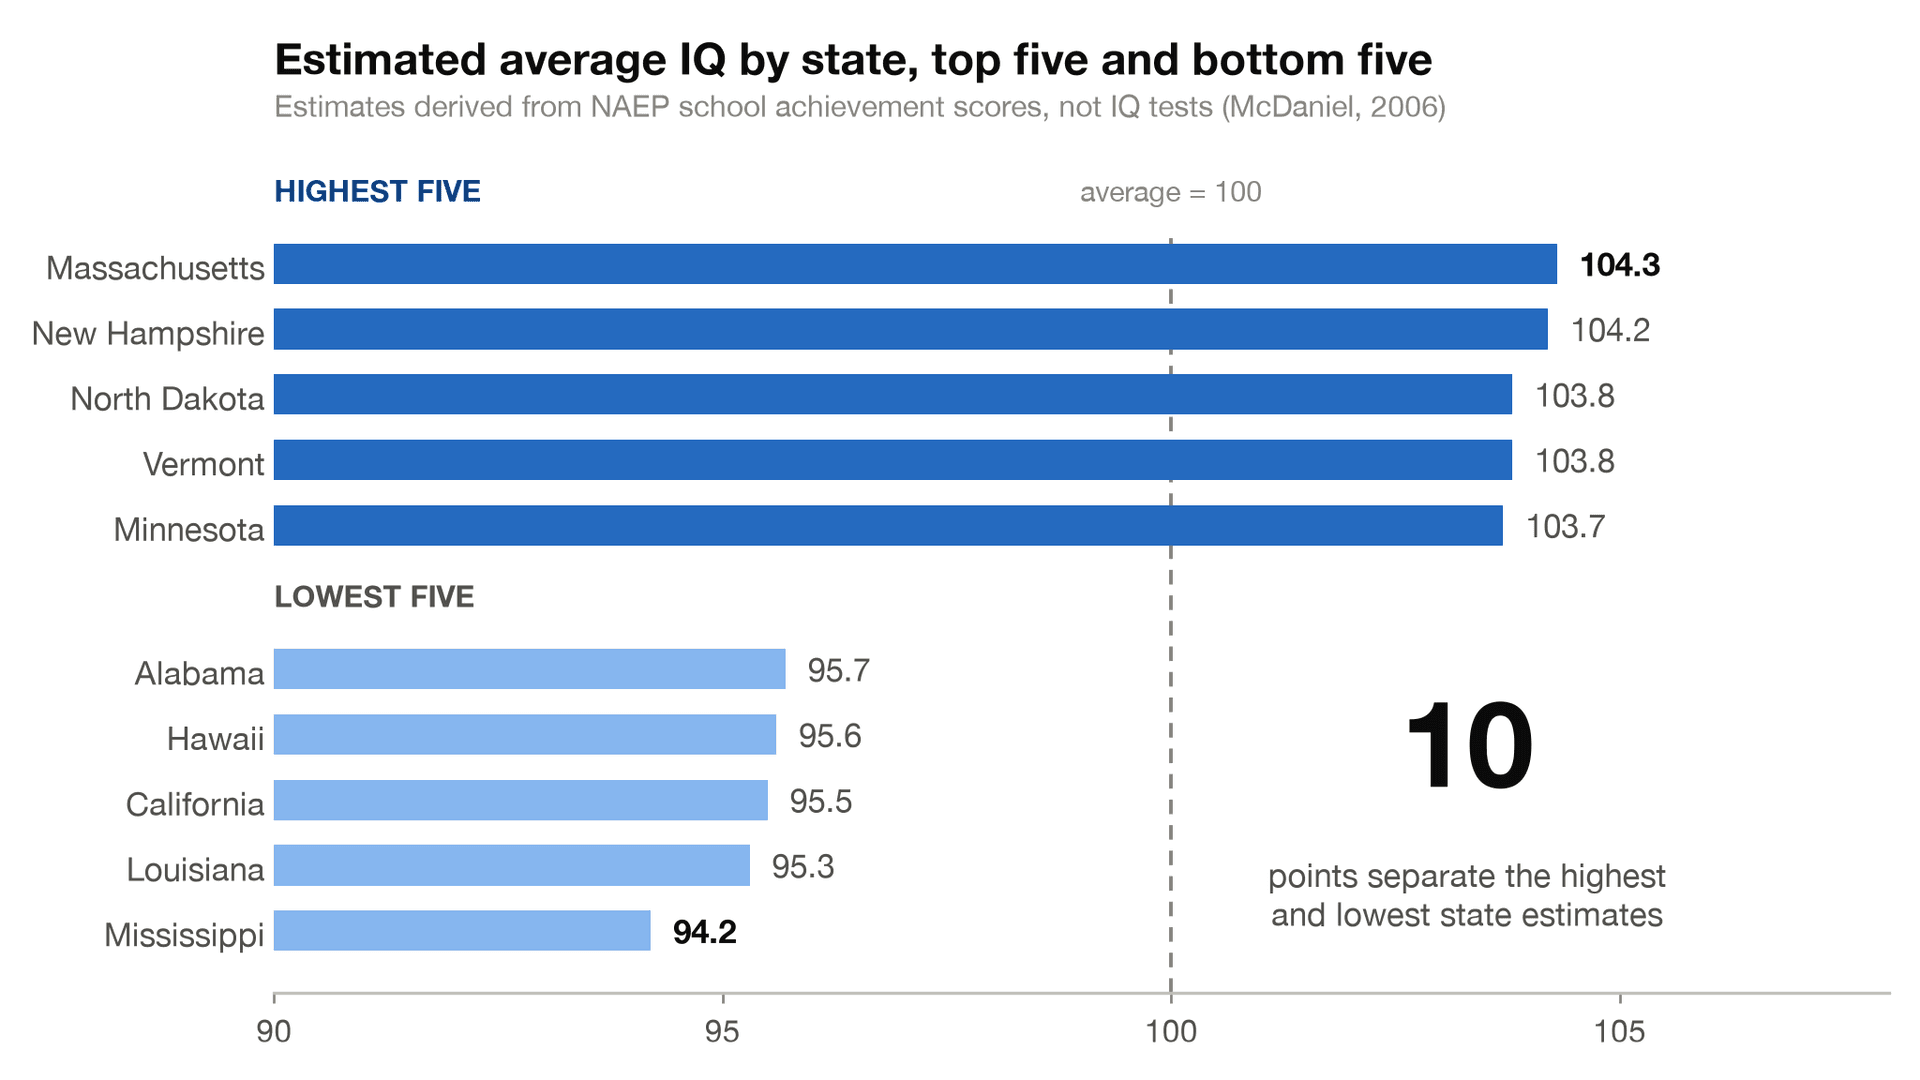
McDaniel (2006) published the standard citable table, with estimates for all 50 states. The highest and lowest entries were:
• Highest five: Massachusetts 104.3, New Hampshire 104.2, North Dakota 103.8, Vermont 103.8, and Minnesota 103.7, with Maine, Montana, Iowa, and Connecticut close behind.
• Lowest five: Mississippi 94.2, Louisiana 95.3, California 95.5, Hawaii 95.6, and Alabama 95.7, with New Mexico at the same 95.7 level.
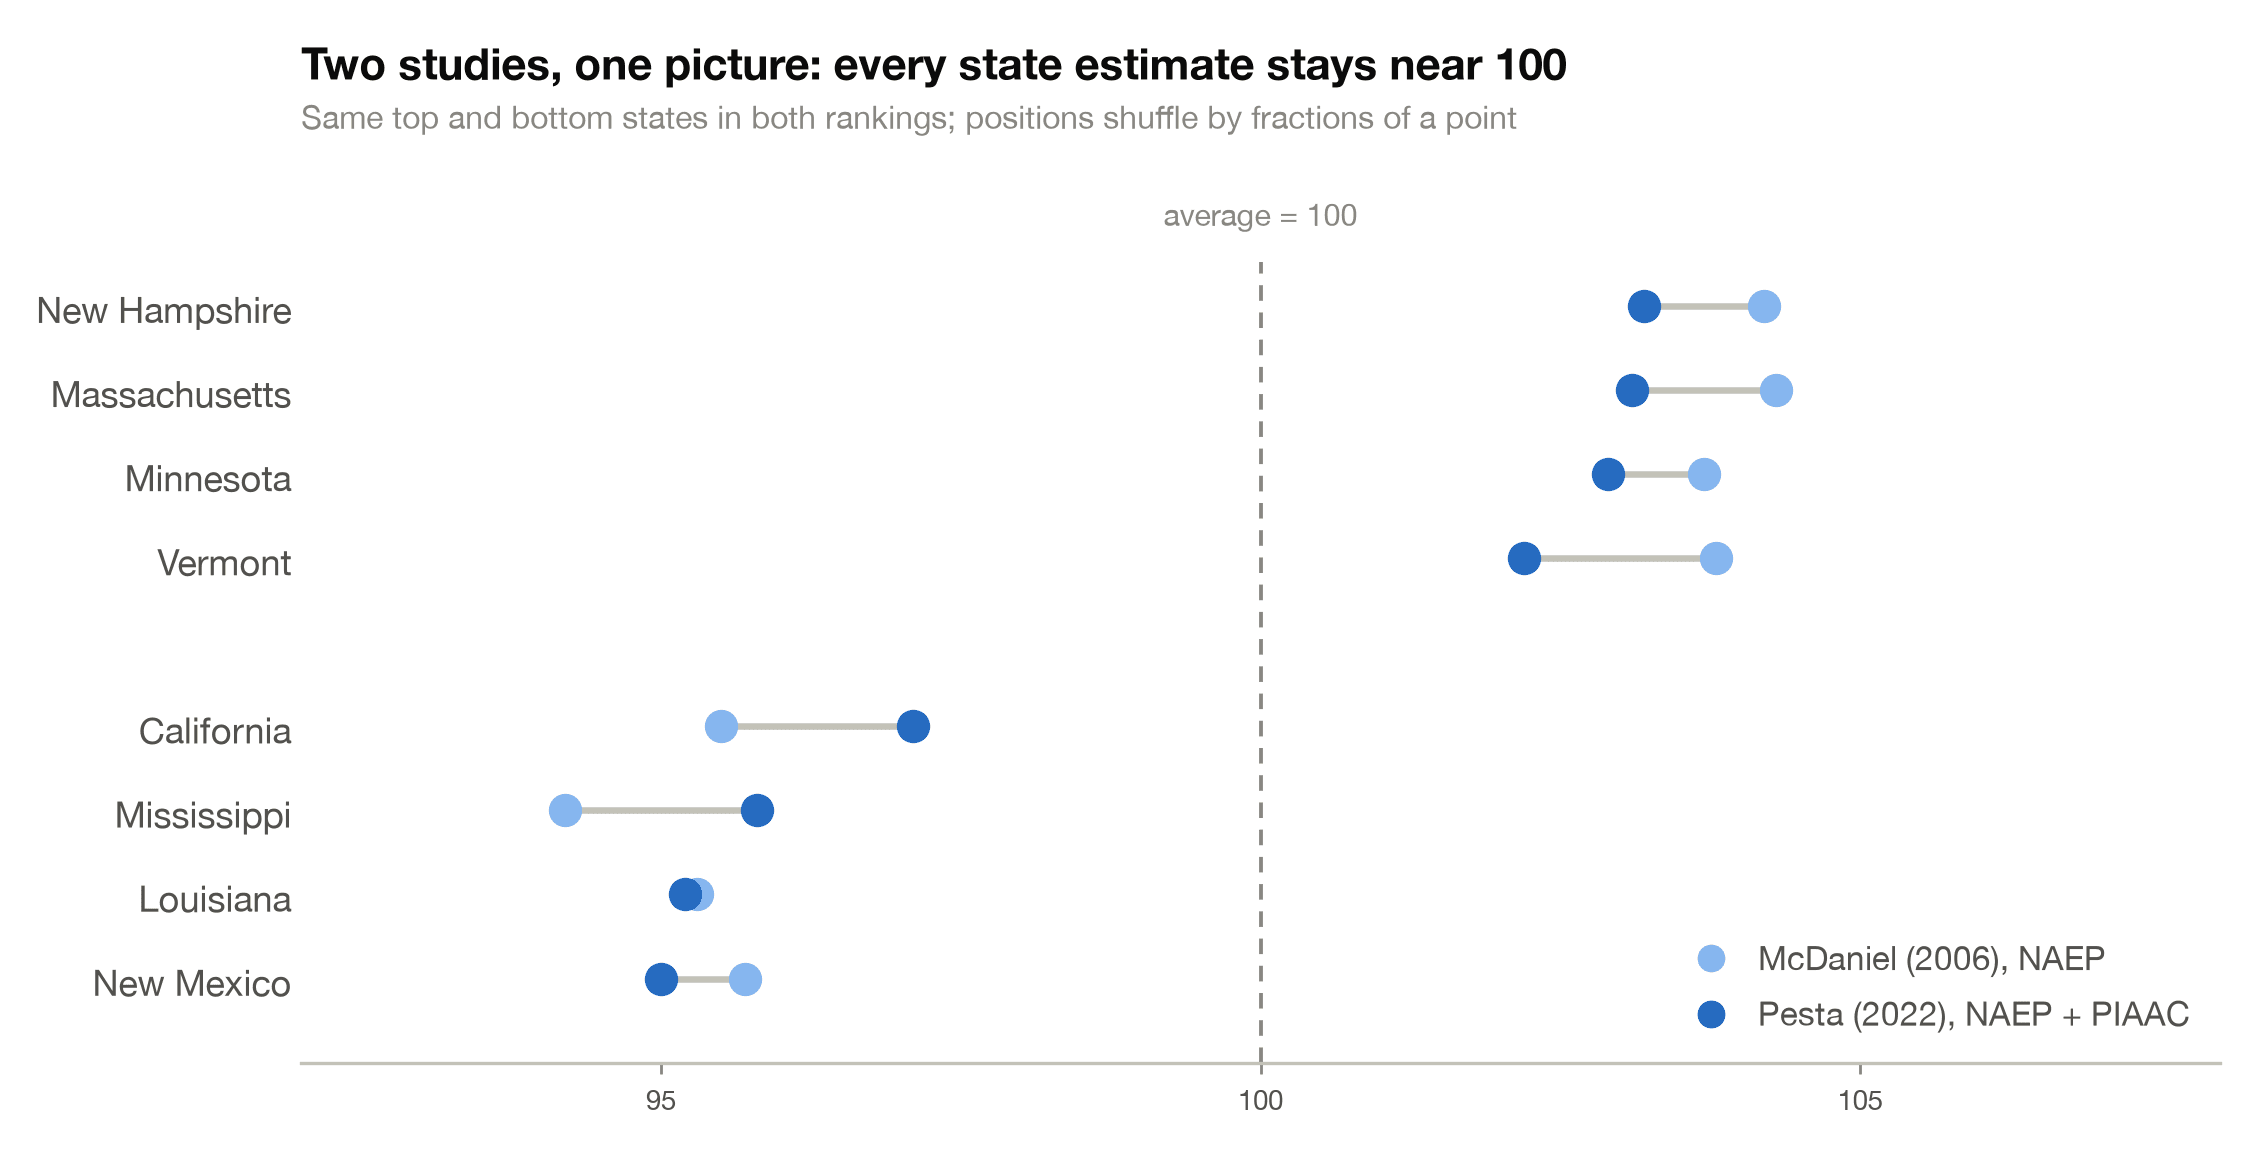
A 2022 update by Pesta produced a similar order: New Hampshire first at 103.2, then Massachusetts at 103.1, Minnesota at 102.9, and Vermont at 102.2, with New Mexico last at 95.0, Louisiana at 95.2, and Mississippi at 95.8. California came 45th at 97.1. The two studies used different data and were published 16 years apart, yet the picture barely moved. Pesta also reports that his estimates correlated 0.58 with state estimates from over 100 years ago, so whatever these proxies measure is quite stable.
Where these numbers actually come from
McDaniel estimated state IQ from the National Assessment of Educational Progress, or NAEP, a congressionally mandated testing program that measures reading and math in grades 4 and 8. NAEP is an achievement test of school subjects, and researchers Rindermann and Thompson describe its scales as measuring "a mixture of general intelligence and specific knowledge." Converting those scores onto an IQ-style scale produces a reasonable proxy, and still a proxy. Pesta's 2022 update added the PIAAC survey of adult skills to the NAEP data, which broadens the picture but does not change its indirect nature.
The method carries known biases that McDaniel himself documents. Only public school NAEP data are published by state, so private-school students are excluded, and the paper explicitly flags this as a source of downward bias. The estimates describe children in public schools, plus adult survey samples in the 2022 version, rather than each state's full adult population.
The 10-point reality check
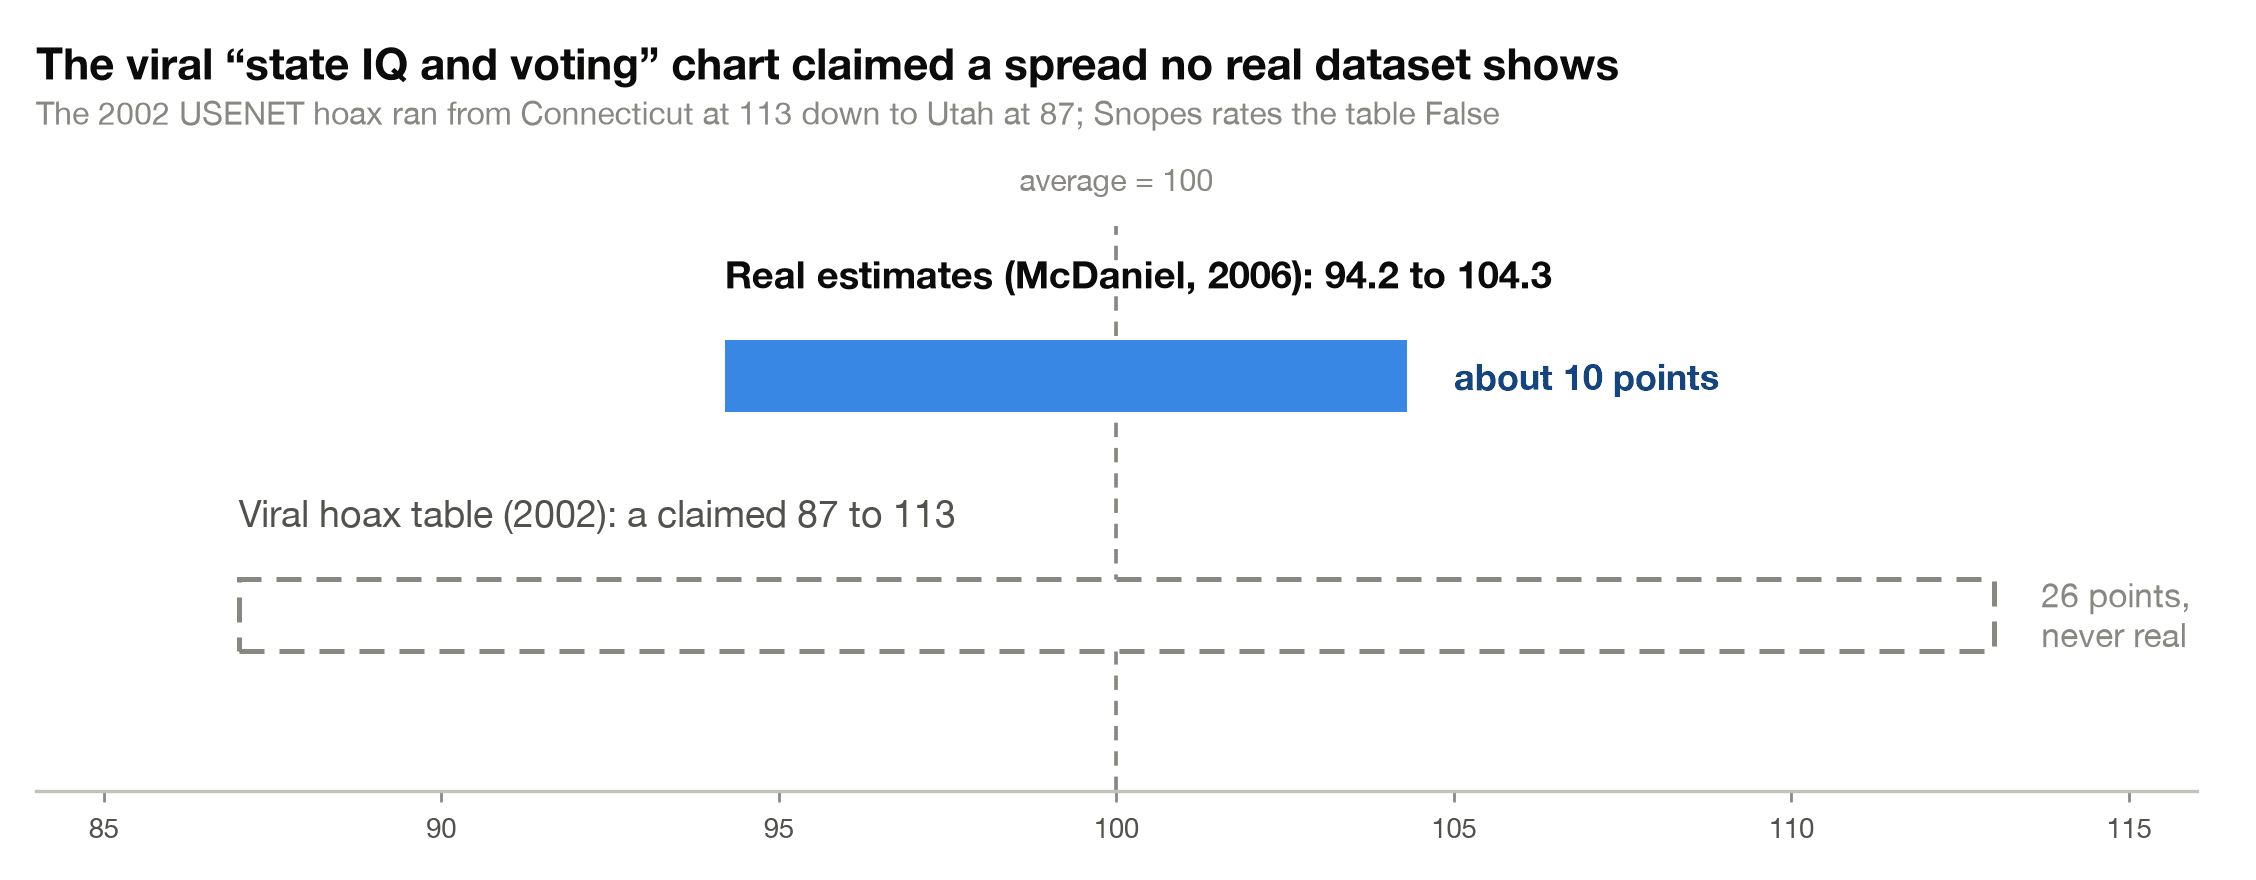
The gap between the highest state estimate (104.3) and the lowest (94.2) is about 10 points, roughly two-thirds of one "standard deviation," the 15-point unit that describes how spread out IQ scores are. Every state's average sits inside the band that psychologists label average. The variation among individuals within any single state dwarfs the differences between states, so a state ranking tells you almost nothing about any particular person. For context on the scale itself, see our guides to the average IQ and the average IQ in the USA.
The viral state IQ hoax
If you have seen a table linking state IQ to how states voted in the 2000 or 2004 presidential elections, you have seen a hoax. Snopes traced it to a phony chart posted to a USENET newsgroup in November 2002 under the name Robert Calvert, and rates the table False. The fake ran from Connecticut at 113 down to Utah at 87, a 26-point spread that no legitimate dataset shows, and it fooled several news outlets, including The Economist. Real estimates span about 10 points.
What the estimates correlate with
McDaniel found that states with higher estimated IQ have greater gross state product, citizens with better health, more effective state governments, and less violent crime, with the violent crime correlation at -0.58. Pesta's update found a 0.80 correlation between state IQ and a composite well-being index, and noted that Massachusetts ranks second in both IQ and income while Louisiana ranks 49th in IQ, 43rd in health, and 45th in education. These are correlations among aggregate estimates. They do not show that IQ causes state outcomes, and each estimate carries its own measurement error.
Why regional IQ rankings deserve skepticism
Our position on state rankings matches our position on country rankings: aggregate IQ estimates built from achievement data are interesting for research and nearly useless for judging people. The samples are indirect, the instruments were never designed to measure IQ, and the real differences are small. Dr. Russell T. Warne, the intelligence researcher who reviews articles on this site, has long cautioned against over-interpreting low-quality regional IQ datasets. Treat every state table, including the one above, as a set of estimates with error bars, never as measured IQ.
Frequently asked questions
Which US state has the highest average IQ?
Massachusetts (104.3) led McDaniel's 2006 ranking and New Hampshire (103.2) led the 2022 update, with Massachusetts, Minnesota, and Vermont close behind. The top states differ by fractions of a point, and all the figures are estimates from achievement tests.
Which state has the lowest average IQ?
Mississippi (94.2) was lowest in the 2006 estimates and New Mexico (95.0) was lowest in the 2022 update, with Louisiana and Mississippi just above it. Even the lowest estimates sit within about 5 points of the national average of 100.
Is the average IQ by state based on real IQ tests?
No. No state gives IQ tests to representative samples. Researchers convert NAEP school achievement scores, plus the PIAAC adult survey in the 2022 update, onto an IQ-style scale, so the numbers are proxies with known biases.
Is the viral chart linking state IQ to voting real?
No. Snopes rates it False. The table first appeared on USENET in 2002 under a fake name, claimed a 26-point spread between Connecticut and Utah, and fooled several news outlets.
How much do state IQ differences actually matter?
The whole 50-state range is roughly 10 points, about two-thirds of one standard deviation, and every state averages in the normal band. Differences within a state dwarf differences between states, so a ranking says almost nothing about an individual.
The takeaway
State IQ tables are estimates built from school achievement data, useful for research on aggregate outcomes and useless for sizing up yourself or your neighbors. If you want a number that actually describes you, take a properly normed instrument. The Reasoning and Intelligence Online Test reports a modern deviation score with stated precision, and you can start with the free IQ test from RIOT IQ.
References
1. McDaniel, M. A. (2006). Estimating state IQ: Measurement challenges and preliminary correlates. Intelligence, 34(6), 607-619. doi.org/10.1016/j.intell.2006.08.007
2. Pesta, B. J. (2022). Updated IQ and well-being scores for the 50 U.S. states. Journal of Intelligence, 10(1), 15. doi.org/10.3390/jintelligence10010015
3. National Center for Education Statistics. (2026). About the Nation's Report Card.nces.ed.gov
4. Mikkelson, D. (2004). State I.Q. voting patterns. Snopes. snopes.com
Take our professional IQ test
Want to know your IQ? Try the first ever professional online IQ test.