What is the average IQ in the world? Each country's tests average 100 by design; global comparisons exist but vary widely in data quality. Here is why.
Dr. Russell T. WarneChief Scientist
Share
By construction, the average IQ is 100 in every country that norms its own tests: the scale is defined so that the middle of each norming population sits at 100. When people ask about “the average IQ in the world,” they usually mean something different: how countries compare when measured against a single yardstick. Published attempts to build such rankings exist, but their data quality varies enormously from country to country, and the honest answer is that cross-national IQ averages are far less precise than the confident tables circulating online suggest.
Why “100” Is Always a Local Number
An IQ score compares you with a “norm group,” a representative sample of people who took the same test. Test publishers renorm nationally: an American Wechsler norm, a German one, a Japanese one. Each sets its own average to 100, which means a 100 in Tokyo and a 100 in Berlin certify the same thing, being typical of your own reference population, not the same absolute performance. Our article on why 100 is the average IQ unpacks that scaling choice.
What Cross-National Comparisons Involve
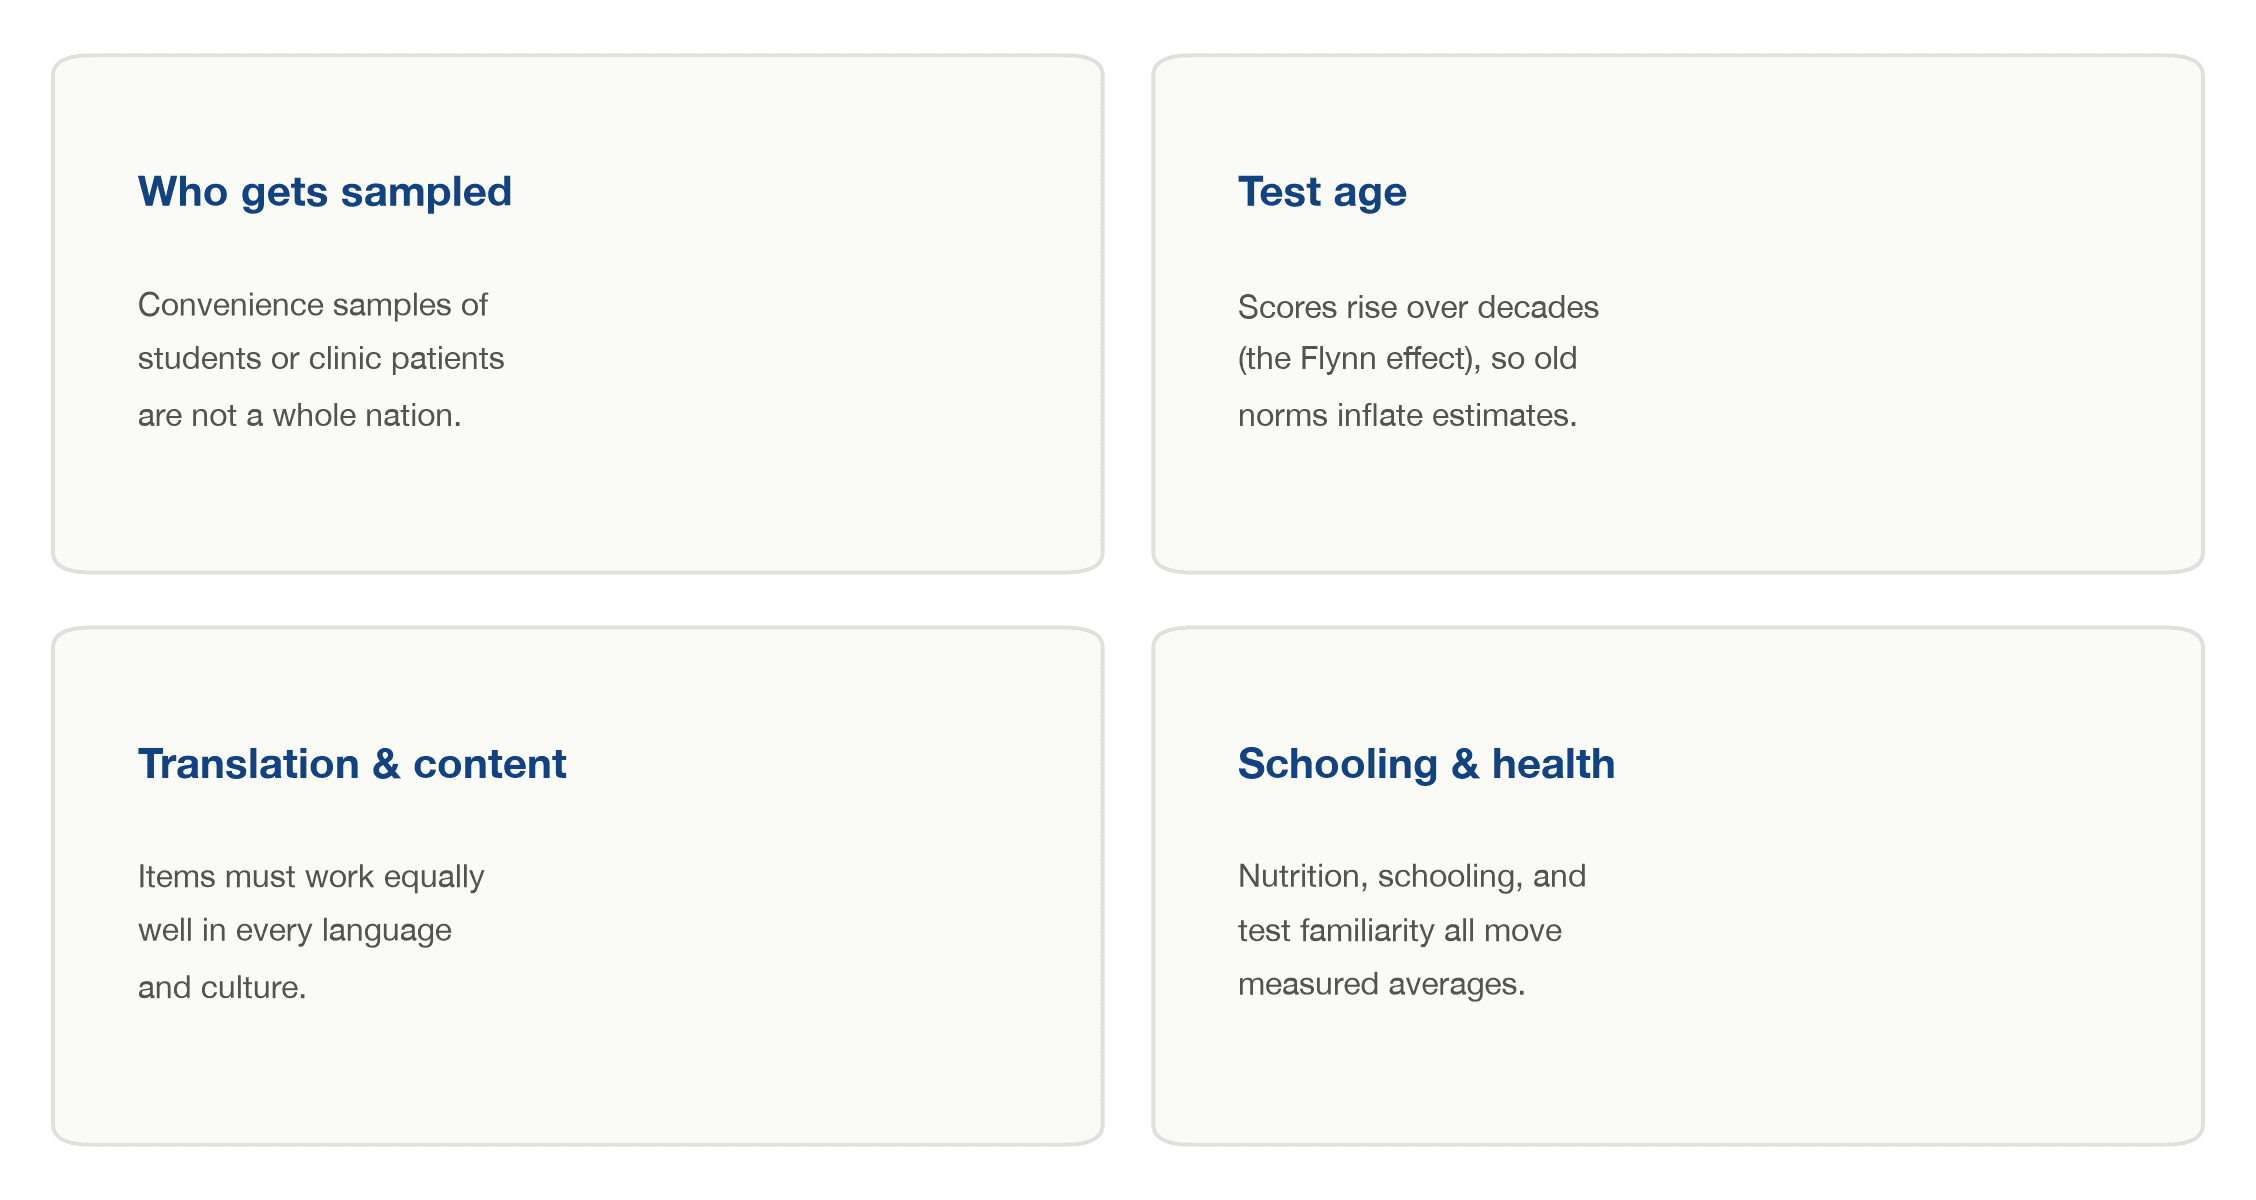
To compare countries at all, researchers must put everyone on one yardstick, usually by anchoring scores to British or American norms. The widely copied national IQ tables trace mostly to compilations by Richard Lynn and colleagues, which assemble whatever studies exist per country. For some countries that is a well-normed national sample; for others it is a handful of small convenience studies, decades old, of unrepresentative groups. Critics have documented both problems and the compilations have been repeatedly revised; treat any single country figure as an estimate with a wide, usually unstated, margin of error.
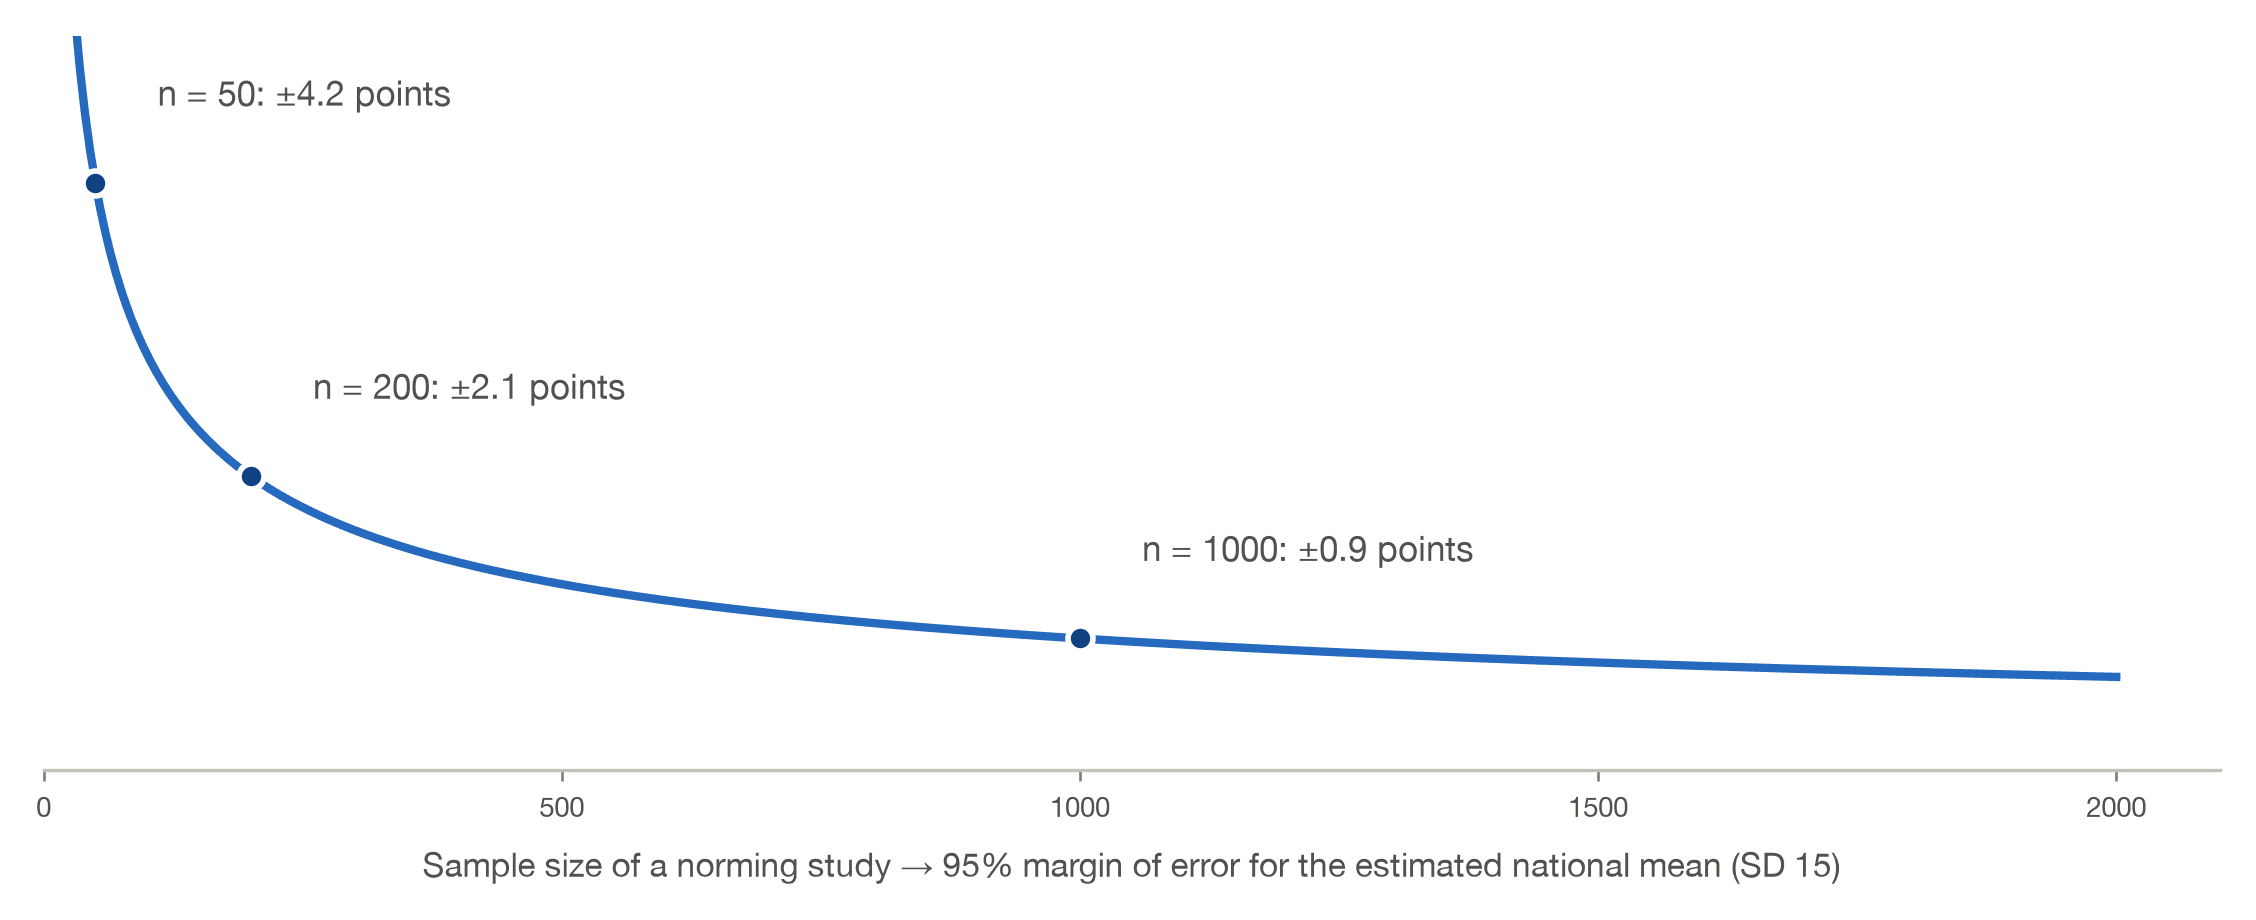
The chart above shows only the statistical floor of the problem: even a perfectly representative sample of 50 people pins a national average no tighter than about plus or minus 4 points. Real studies add every other complication.
What Is Solid in This Literature
Skepticism about specific rankings does not mean nothing is known. Three findings stand on strong evidence.
• The g factor is universal: Reanalyzing test data from 31 non-Western countries, Warne and Burningham found the same “general intelligence” factor that appears in Western samples in nearly every dataset examined, evidence that the tests measure the same underlying construct across cultures.
• Scores rise over time: The “Flynn effect,” documented across more than a century of data worldwide, shows measured IQs rising about three points per decade as nutrition, schooling, and test familiarity improve. Comparing countries tested in different decades without correcting for this guarantees distortion.
• Independent yardsticks correlate: National IQ estimates track international student assessments like PISA and TIMSS strongly, as Rindermann showed, and both track harmonized learning measures compiled in Nature by Angrist and colleagues. Whatever these instruments capture, they capture it consistently.
The Flynn effect deserves special emphasis in this context because of its size. The formal meta-analysis by Pietschnig and Voracek, covering a century of data and nearly four million test-takers, put the worldwide gain at roughly 28 points over 100 years. That is nearly two standard deviations, larger than most of the gaps between countries in any published table. A country measured with a test normed 30 years ago will look about 8 points better than it would on fresh norms, purely as an artifact. Much of the spread in international tables is this artifact wearing a flag.
How to Read Any National IQ Table
When you meet a country ranking online, three questions sort the defensible from the invented: How many studies, how large, and how recent? Was the sample meant to represent the whole country? And has the figure been adjusted for when the test was normed? Tables that cannot answer those questions are decoration, not data. For comparisons within one norm, where the ground is firmer, see our articles on the average IQ in the USA and the average IQ by age.
Measure Yourself Against a Real Norm
Whatever the global tables say, your own score only means something against a well-built norm group. The Reasoning and Intelligence Online Test, developed by a team led by intelligence researcher Dr. Russell T. Warne, reports your standing on the standard 100-point scale with its measurement precision shown. Take the RIOT IQ test.
Frequently Asked Questions
What is the average IQ in the world?
On each country's own tests, 100 by definition. On a single anchored yardstick, published estimates put many national averages between the low 60s and about 108, but data quality varies so much that precise figures deserve caution.
Which country has the highest average IQ?
Compilations consistently place East Asian countries such as Japan, South Korea, Singapore, and China at or near the top, a pattern echoed by international student assessments.
Are low national estimates about genetics?
The documented drivers are environmental and methodological: nutrition, health, schooling access, test familiarity, and thin sampling. The Flynn effect shows national averages move substantially within generations.
Is a 100 in one country equal to a 100 in another?
Not in absolute terms. Each 100 marks the average of its own norm group; converting between norms requires anchoring studies with their own error.
Why do different websites show different numbers?
They copy different editions of the same compilations, round differently, and rarely disclose sample sizes or test dates. The variation itself is the tell.
References
1. Angrist, N., Djankov, S., Goldberg, P. K., & Patrinos, H. A. (2021). Measuring human capital using global learning data. Nature, 592, 403–408. doi.org/10.1038/s41586-021-03323-7
2. Pietschnig, J., & Voracek, M. (2015). One century of global IQ gains: A formal meta-analysis of the Flynn effect (1909–2013). Perspectives on Psychological Science, 10(3), 282–306. doi.org/10.1177/1745691615577701
3. Rindermann, H. (2007). The g-factor of international cognitive ability comparisons: The homogeneity of results in PISA, TIMSS, PIRLS and IQ-tests across nations. European Journal of Personality, 21(6), 667–706. doi.org/10.1002/per.634
4. Warne, R. T. (2020). In the know: Debunking 35 myths about human intelligence. Cambridge University Press. doi.org/10.1017/9781108593298
5. Warne, R. T., & Burningham, C. (2019). Spearman's g found in 31 non-Western nations: Strong evidence that g is a universal phenomenon. Psychological Bulletin, 145(3), 237–272. doi.org/10.1037/bul0000184
Hero image: The Blue Marble, Apollo 17, 1972, NASA. Public domain.
Take our professional IQ test
Want to know your IQ? Try the first ever professional online IQ test.