Average IQ by Country: Why the Rankings Are Unreliable
Average IQ by country rankings rest on tiny, unrepresentative samples. Here is what the evidence really shows, from PISA and TIMSS to the Flynn effect.
Dr. Russell T. WarneChief Scientist
Share
Nearly every "average IQ by country" table online traces back to a single compilation dataset, begun by Richard Lynn and Tatu Vanhanen in 2002 and last updated by Lynn and David Becker in 2019. Peer-reviewed audits have found that it rests on tiny convenience samples and on unrepresentative groups passed off as national averages, with dozens of further countries assigned scores by extrapolation from their neighbors. Angola's "national IQ" comes from 19 people; Eritrea's comes from orphanage children. This article will not print a ranking table, because reliable country-by-country IQ averages do not exist. What follows is where the numbers come from, how far they move under scrutiny, and what the defensible cross-national data actually show.
Where the numbers actually come from
The 2019 version of the dataset provides "measured IQ" for 131 countries and extrapolated IQs for a further 72, and those figures propagate through countless websites that present them as settled measurements. An independent audit by the demographer Rebecca Sear examined the samples behind the numbers and concluded that the dataset is not fit for purpose (Sear, 2022).
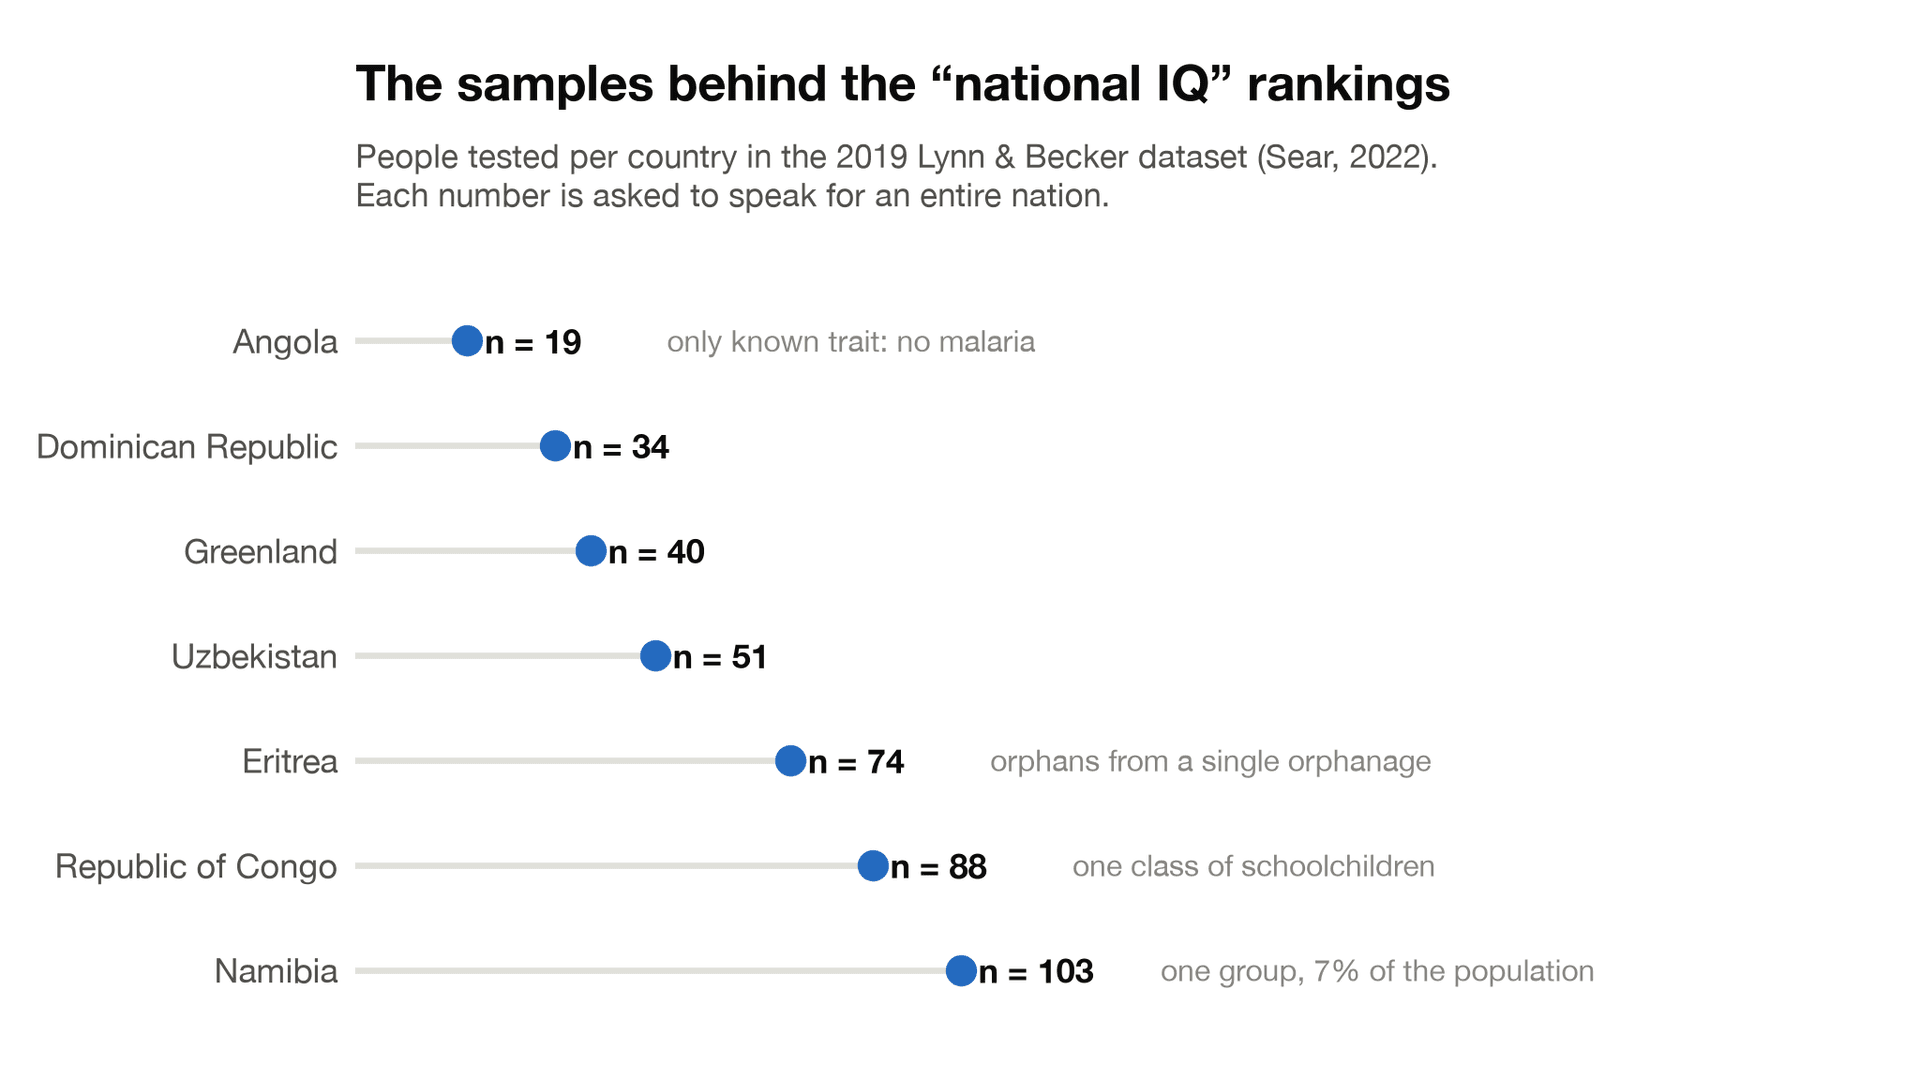
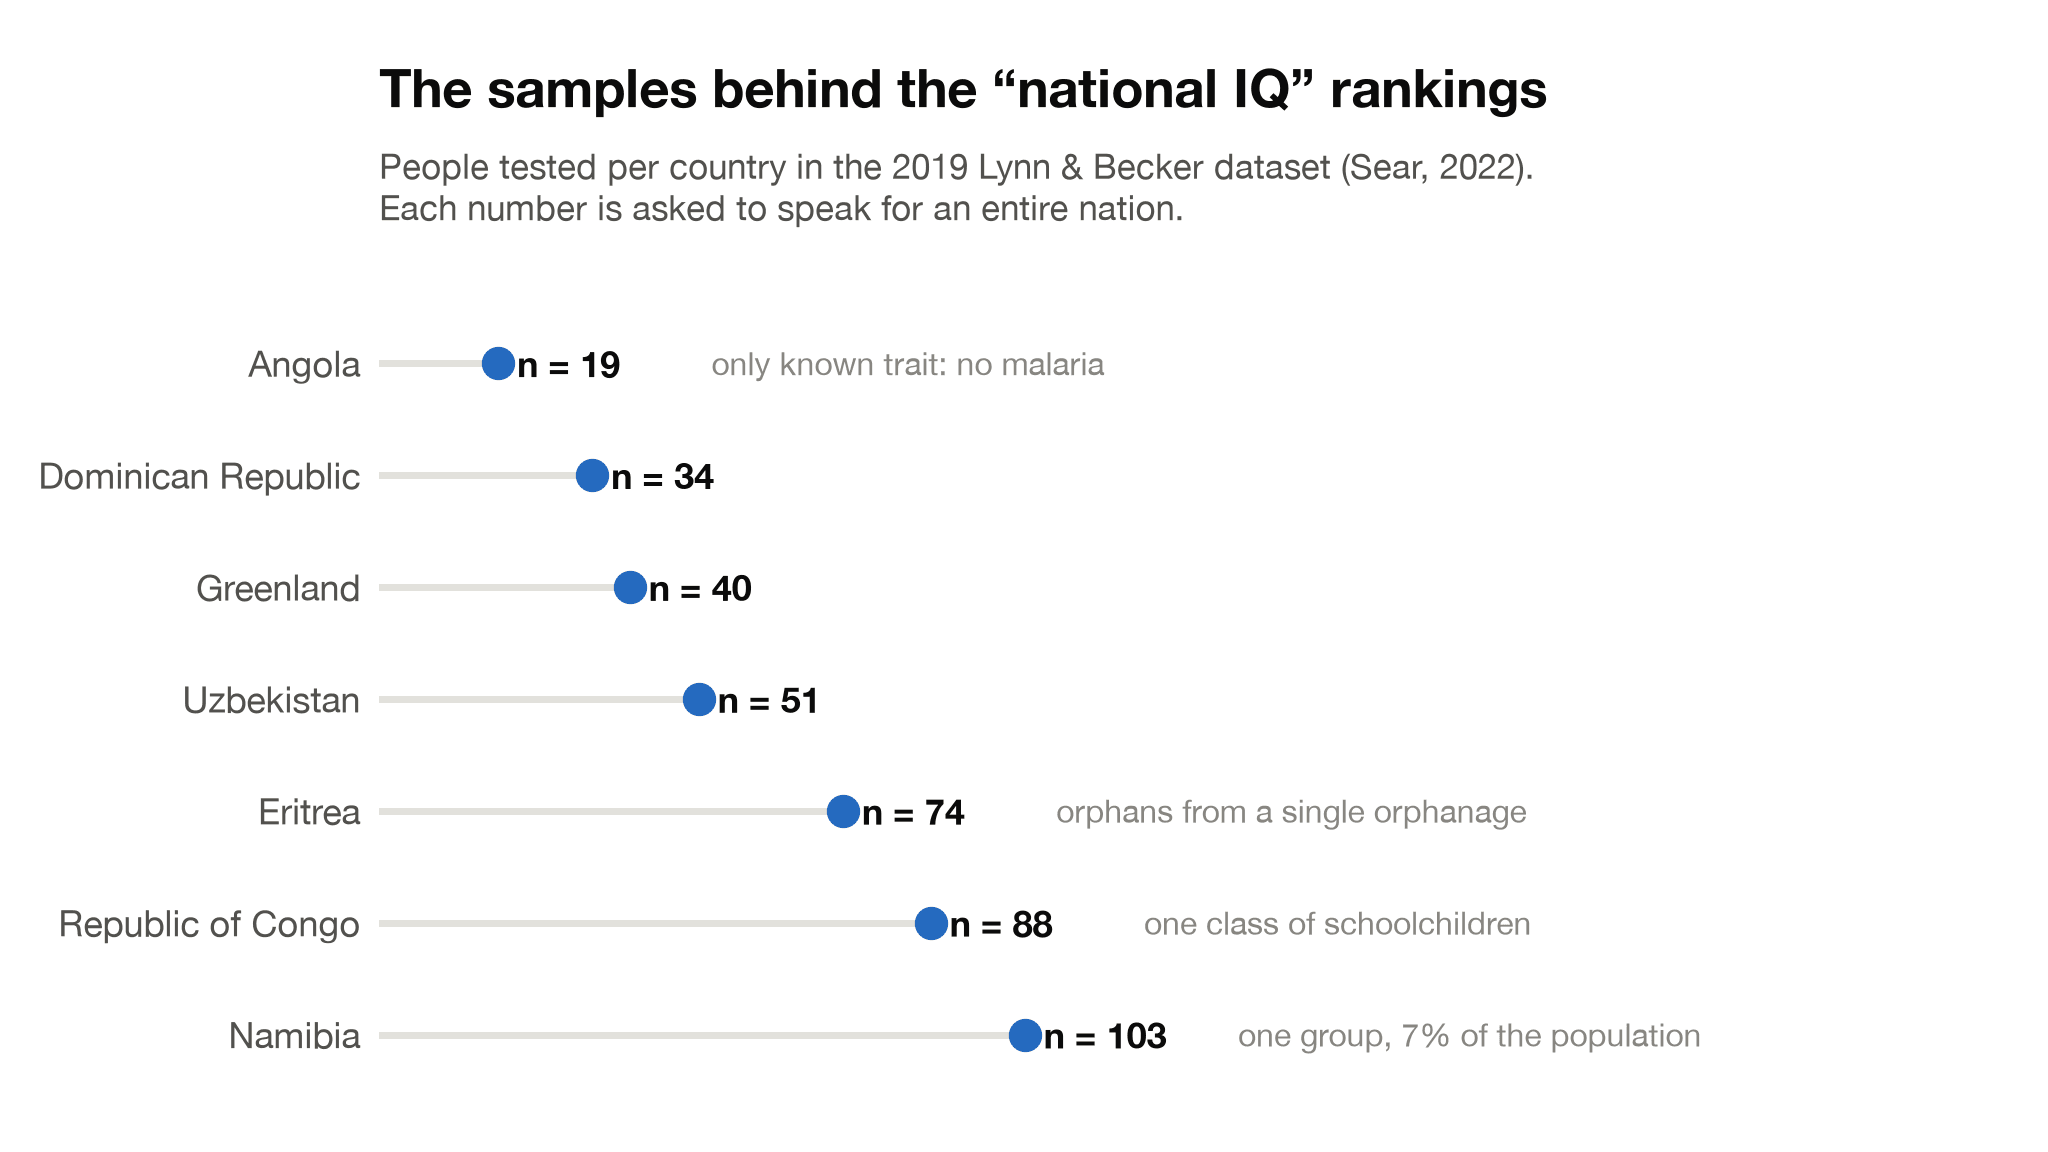
The details are worse than the summary. Six countries have IQs estimated from fewer than 100 individuals: Angola's rests on 19 people whose only recorded characteristic is that they did not have malaria, the Dominican Republic's on 34, Greenland's on 40, Uzbekistan's on 51, and the Republic of Congo's on one sample of 88 schoolchildren, with a further 14 countries resting on samples under 200. Roughly 30 percent of countries are represented by a single sample. Eritrea's "national IQ" is estimated entirely from small samples of children living in orphanages, including one sample of 74 orphans from a single orphanage coded in the dataset as national. Namibia's rests on 103 children from an ethnic group that makes up about 7 percent of the country's population. Because these problems differ by world region, Sear concluded, the dataset is systematically biased as well as inaccurate.
How far bad data moves the numbers: a 12-point case study
Lynn's compilations put the average IQ of sub-Saharan Africa below 70. When Jelte Wicherts, Conor Dolan, and Han van der Maas systematically reviewed the published literature and applied consistent inclusion rules, the estimate came out at approximately 82 against UK norms, and the authors added that more psychometric research is needed on the measurement bias of Western tests used outside the populations they were normed for (Wicherts et al., 2010). Changing the inclusion rules alone moved the estimate by roughly 12 points. That swing is larger than most of the between-country gaps the ranking tables invite readers to marvel at, which tells you how much of any ranking is method rather than measurement.
The tests are not the problem; the compilation is
None of this indicts IQ testing itself. Professionally developed tests, administered to the populations they were normed on, are among the most reliable and best validated instruments in psychology. Dr. Russell T. Warne, whose peer-reviewed evaluation of the national IQ dataset is among the most thorough available, documents its data quality problems in detail while urging researchers to "chart a middle course and reject the false dichotomy of either accepting the scores without reservation or rejecting the entire dataset out of hand" (Warne, 2023). That middle course is this article's position: sound instruments, unsound compilation.
National averages are moving targets: the Flynn effect
Even a well-measured national average would refuse to sit still. James Flynn documented massive IQ gains across 14 nations during the 20th century (Flynn, 1987), and a formal meta-analysis covering 271 samples and almost 4 million participants in 31 countries put the worldwide rise at about 0.28 full-scale IQ points per year, roughly 2.8 points per decade (Pietschnig & Voracek, 2015). The compilation datasets pool studies from very different decades without consistent correction for these gains, so a table that sets a 1960s sample from one country beside a 2010s sample from another is comparing eras as much as nations.
What the defensible data show: PISA and TIMSS
Well-sampled cross-national data do exist. PISA, run by the OECD, measures 15-year-old students' reading, mathematics, and science literacy on a fixed cycle; 81 countries and economies took part in 2022, and the students sampled are designed to represent all 15-year-olds in each system, whatever type of school they attend. TIMSS has tested mathematics and science at grades 4 and 8 every four years since 1995, with 64 countries in its 2023 cycle. Both are school achievement assessments rather than IQ tests, and neither yields a "national IQ." Their virtue is exactly what the compilation lacks: rigorous, documented sampling.
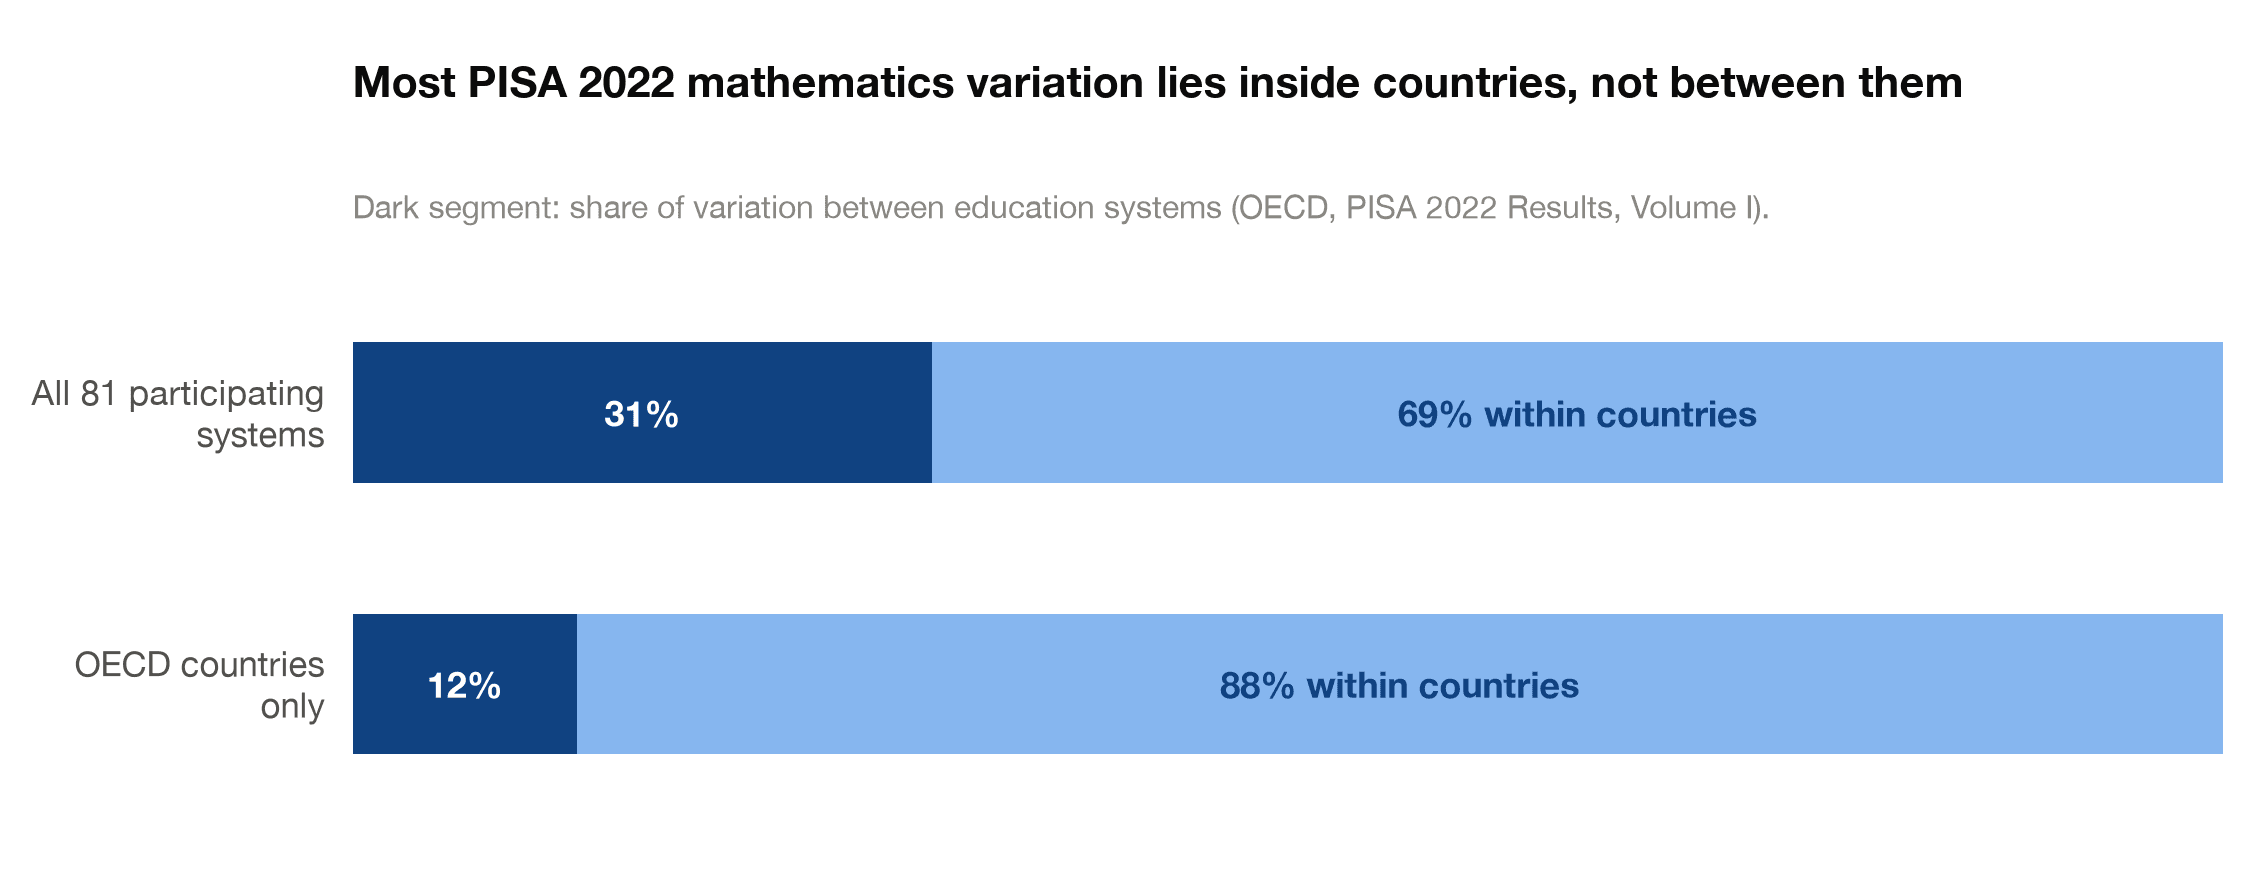
The well-sampled data also puncture the ranking mindset. In PISA 2022 mathematics, about 31 percent of the variation in performance across all participating systems is linked to differences between systems; across OECD countries the figure is only 12 percent. The rest sits inside countries. On average across the OECD, 235 score points separate a country's own 90th and 10th percentiles, a spread far wider than the typical gap between national means. National distributions overlap enormously, a point worth keeping in mind on every country page, including our own article on the average IQ in China.
Frequently asked questions
Which country has the highest average IQ?
Nobody can say with confidence. The circulating rankings are built from a compilation with national averages estimated from as few as 19 people, and well-sampled assessments like PISA and TIMSS measure school achievement rather than IQ.
Why are average IQ by country rankings unreliable?
The underlying dataset leans on tiny convenience samples, children and special populations generalized to whole nations, imputed scores, and mismatched tests from different decades. Errors of that size swamp the between-country differences the rankings claim to measure.
Does this mean IQ tests themselves are invalid?
No. Professionally developed IQ tests are reliable and valid when administered to the populations they were normed on. Measuring an individual well and ranking 200 countries from scraps are entirely different problems.
What is the best data for comparing countries?
International assessments with real sampling frames: PISA (81 countries and economies in 2022) and TIMSS (64 countries in 2023). They measure school achievement, and they are the defensible cross-national evidence.
Can a country's average IQ change over time?
Yes, substantially. The Flynn effect shows full-scale scores rose by roughly 0.28 points per year across the 20th century, so a ranking that mixes samples from different decades is comparing different eras, not just different nations.
The bottom line
A ranking is only as strong as its weakest rows, and the national IQ tables have rows built on 19 people. Treat any confident country-by-country IQ list as entertainment. If you want a number that means something, measure yourself against a real norm: the Reasoning and Intelligence Online Test from RIOT IQ reports properly normed scores with stated precision, and you can start with the free RIOT IQ test.
References
1. Flynn, J. R. (1987). Massive IQ gains in 14 nations: What IQ tests really measure. Psychological Bulletin, 101(2), 171-191. doi.org
2. Pietschnig, J., & Voracek, M. (2015). One century of global IQ gains: A formal meta-analysis of the Flynn effect (1909-2013). Perspectives on Psychological Science, 10(3), 282-306. doi.org
3. Sear, R. (2022). 'National IQ' datasets do not provide accurate, unbiased or comparable measures of cognitive ability worldwide [Preprint]. PsyArXiv. doi.org
4. Warne, R. T. (2023). National mean IQ estimates: Validity, data quality, and recommendations. Evolutionary Psychological Science, 9, 197-223. doi.org
5. Wicherts, J. M., Dolan, C. V., & van der Maas, H. L. J. (2010). A systematic literature review of the average IQ of sub-Saharan Africans. Intelligence, 38(1), 1-20. doi.org
6. OECD. (2023). PISA 2022 results (Volume I): The state of learning and equity in education. OECD Publishing. oecd.org
7. TIMSS & PIRLS International Study Center, Boston College. (2024). TIMSS 2023 international results in mathematics and science.timss2023.org
Take our professional IQ test
Want to know your IQ? Try the first ever professional online IQ test.