Aug 3, 2026·Special Population & Related ConditionsWhat Is the Average IQ in China?
Where does China rank in global IQ scores? Discover the 104–106 average, the urban-rural gap, and the impact of the Gaokao. Read and try the RIOT test!
Dr. Russell T. WarneChief Scientist

China consistently appears at or near the top of every national IQ ranking published in the research literature — and consistently attracts more methodological controversy than almost any other country on those same lists. Taking an IQ test and comparing your score to China's national average requires understanding not just what the number is, but where it comes from, what population it actually reflects, and why estimates across different sources span a surprisingly wide range. The headline finding is real: China scores higher on average than nearly every other country in the world on standardized cognitive assessments. The reasons behind that finding are more complex — and more interesting — than either the number or the criticism of the number typically conveys.
What the Data Actually Shows
The figures across different reputable sources span a meaningful range, reflecting genuine methodological disagreement rather than simple error. 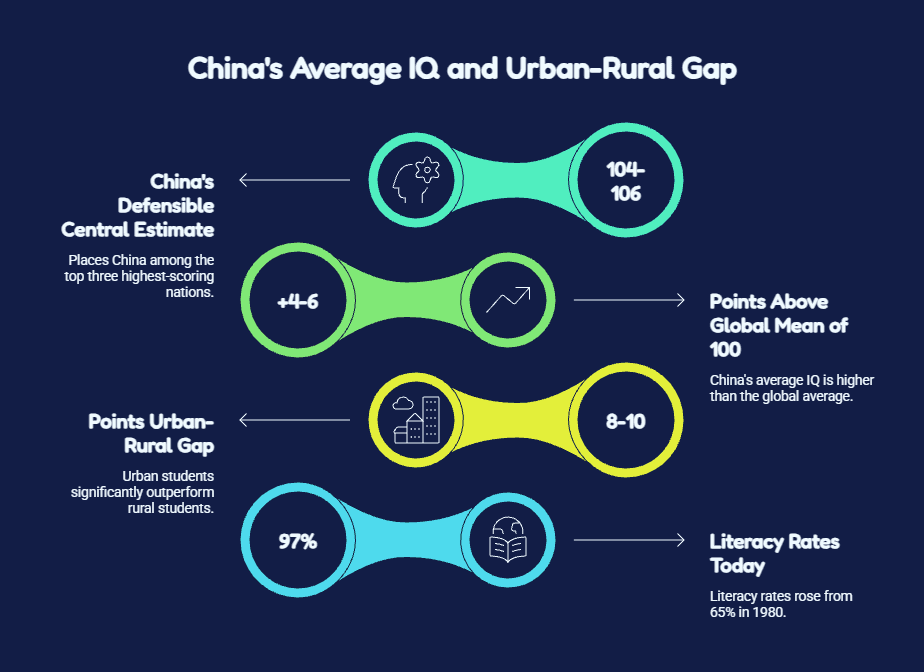 The most widely cited estimate in the academic literature, drawn from Lynn and Vanhanen's national IQ dataset and updated through David Becker's 2019 compilation, places China at approximately 104–105. Some aggregators using the same underlying data produce slightly different figures depending on how they weight studies and handle missing data: IQ Career Lab places China at 106, ranked second of 195 countries; IQ Exam places it at 107.19; and CogniDNA placed it at 104.10 before shutting down in 2025. The International IQ Test dataset — based on over 1.2 million online test-takers who completed the same instrument in 2024–2025 — places China at approximately 106.48, with Hong Kong leading at 107.73 and South Korea at 106.97. The World Population Review 2026 summary reflects the same cluster: Hong Kong (107.73), South Korea (106.97), and China (106.48) report the highest average IQ scores in 2026, with Japan close behind. For practical purposes, the most defensible central estimate is approximately 104–106, placing China consistently among the three highest-scoring nations in the world alongside Hong Kong and South Korea, and approximately 4–6 points above the global mean of 100.
Why the Estimates Vary — and Why That Matters
The range from 104 to 107 across different sources isn't random noise. It reflects three specific methodological factors that produce genuinely different answers to what is ostensibly the same question. Sample representativeness. The Lynn and Vanhanen dataset, for all its breadth, was compiled from studies conducted across different time periods, different instruments, and — critically — different populations within China. Some early studies overrepresented urban, educated populations; others drew from rural samples. A country of 1.4 billion people with enormous geographic and socioeconomic diversity cannot be accurately represented by a handful of convenience samples, and the resulting estimates carry wider uncertainty bands than the precision of any single reported figure implies. Online self-selection. The International IQ Test dataset, despite its impressive scale of 1.2 million respondents, suffers from a different problem: the people who choose to take an online IQ test in any country are not a representative sample of that country's population. In China, where internet access, English proficiency, and interest in online cognitive testing are all unevenly distributed across demographics, the self-selected sample is likely to skew urban, educated, and above average — which would produce estimates higher than the true national mean. The urban-rural gap. This is the most consequential source of variation, and the one most consistently underreported in popular discussions of China's IQ average. China's average IQ is roughly 104–105, but these figures mask an urban-rural gap of approximately 8–10 points. Shanghai students routinely rank first or second globally in PISA mathematics and reading — but Shanghai is not a representative national sample. It is one of China's most educationally advantaged urban populations, and treating Shanghai's performance as indicative of China's national cognitive level would be equivalent to estimating the United States' average IQ from Harvard students. Research on the urban-rural cognitive gap in China is consistent and well-documented. Urban students significantly outperform rural students in standardized test scores, cognitive achievement, and other assessments, with the gap driven by unequal access to educational resources, the concentration of skilled teachers in cities, and the persistent effects of the hukou system that limits rural families' access to urban educational opportunities. Rural inequality in educational development is more prominent than urban inequality across provinces, meaning the within-China variation in cognitive outcomes is itself unevenly distributed.
What Drives China's High Average
Accepting that China's average is genuinely above the global mean — as the consistent pattern across multiple independent data sources supports — the more interesting question is what explains it. Several structural factors converge to push the Chinese average upward.
The Gaokao and its preparation culture. The National College Entrance Examination — the Gaokao — is one of the most cognitively demanding mass-administered standardized tests in the world. The Gaokao functions as the primary mechanism for university admission, with provincial-level authorities matching students to universities purely on score, regardless of gender, ethnicity, or family income. The preparation culture this creates — years of sustained, intensive academic engagement across mathematics, science, and language — provides exactly the kind of cognitive stimulation that the Flynn Effect literature identifies as driving population-level IQ gains. Students who spend years doing complex mathematics under examination pressure are doing something very similar to what structured cognitive training does: repeatedly exercising the reasoning, working memory, and processing speed systems that standardized cognitive tests measure.
Educational investment and expansion. China has invested heavily in educational access and quality since the 1980s, with literacy rates rising from approximately 65% in 1980 to over 97% today. The expansion of compulsory education, the reduction in class sizes in urban areas, and the ongoing effort to close the urban-rural educational gap have all contributed to population-level cognitive development. The Flynn Effect mechanism — more years of formal education driving higher IQ scores — applies directly here. Each additional year of schooling raises measured IQ by approximately 1–5 points on average, and China's dramatic expansion of educational attainment across cohorts is one of the most plausible explanations for its high average.
Nutrition and health improvements. The reduction in malnutrition and iodine deficiency across China's population over recent decades represents another direct pathway to cognitive gains. Iodine deficiency alone can reduce IQ by 8–12 points, and its elimination through salt iodization programs produces measurable population-level cognitive gains. China's comprehensive public health investment — including nutrition programs, vaccination, and maternal health — has addressed many of the environmental suppressors of cognitive development that continue to depress averages in lower-income countries.
The Methodological Limitations That Require Honest Acknowledgment
No discussion of China's national IQ estimate is complete without flagging the specific methodological problems that make these figures more uncertain than they appear. The Lynn-Vanhanen dataset — the most academically cited source — has been criticized for relying on studies of uneven quality, varying time periods, and non-representative samples. For China specifically, the sample of underlying studies is small relative to the country's population and geographic diversity. A country with 1.4 billion people whose educational and developmental conditions range from world-class urban schools to severely under-resourced rural communities cannot be reliably characterized by the limited study samples available in the literature. The PISA and TIMSS data that often serve as validation for China's high estimates face the same representativeness problem in a different form. China does not submit a nationally representative PISA sample — it submits samples from selected provinces or cities, historically dominated by the educationally advantaged eastern urban regions. The OECD has worked with China to expand the geographic coverage of its PISA samples, but the results still cannot be treated as straightforwardly representative of the full population. IQ tests developed in Western contexts and translated for use in China face the additional challenge of cultural loading — items that assume familiarity with Western conceptual frameworks, testing conventions, or reference materials may not transfer cleanly, and the direction of any bias is not always predictable.
China in the East Asian Context
China's estimated average of 104–106 sits within a tight cluster of East Asian countries that consistently dominate the top of cognitive ranking tables. Every one of the five statistical outliers at the top of the ranking in the most recent large-scale dataset is in East Asia — Hong Kong, South Korea, China, Japan, and Singapore. The consistency of this geographic clustering across independent datasets and different measurement approaches makes it difficult to dismiss as a methodological artifact.
The shared factors among these nations — intensive educational cultures, high socioeconomic investment in human capital, cultural emphasis on academic achievement, and historically rapid economic development — are exactly what the environmental literature on IQ predicts should produce high national averages. None of these factors imply anything about innate cognitive capacity; they describe environmental conditions that the research consistently shows drive measurable cognitive development.
China's position within this cluster — above Japan (approximately 106.48 in some datasets, slightly lower in others) and close to South Korea — reflects a genuine convergence of educational intensity and population investment rather than any fixed national characteristic.
What the Number Doesn't Tell You
China's national average of approximately 104–106, whatever its precise value, conceals more than it reveals about the actual distribution of cognitive ability across the country's 1.4 billion people. The urban-rural gap alone produces a within-country variation that swamps the between-country differences that make the national average seem significant. A Beijing resident with a university-educated family, strong public schools, and access to supplementary tutoring is developing in a cognitive environment that likely produces scores well above the national average. A child growing up in a resource-poor rural county with limited teacher quality, inadequate nutrition support, and minimal access to cognitive enrichment is developing in an environment that likely produces scores well below it. Individual variation within China far exceeds the variation between China and other countries. The national average tells you something real about aggregate developmental conditions — but it tells you nothing meaningful about any individual Chinese person's cognitive profile, and it should not be read as making any statement about inherent national cognitive capacity.
The Takeaway
China's average IQ is most defensibly estimated at approximately 104–106, placing it consistently among the top three countries in the world alongside Hong Kong and South Korea. The estimate is supported by multiple independent datasets and is consistent with PISA and TIMSS performance data, though the specific figure is contested and uncertain due to representativeness problems, urban-rural gaps of approximately 8–10 points, and the limitations of both the Lynn-Vanhanen methodology and online self-selected samples.
The drivers behind the high average are primarily environmental — the Gaokao preparation culture, decades of educational expansion, nutrition improvements, and the broader developmental investment that accompanies rapid economic growth. None of these factors imply fixed cognitive limits, which is also why the convergence of East Asian nations at the top of cognitive rankings is best understood as the outcome of specific educational and developmental conditions rather than as a statement about any population's inherent capacity. If you want to understand where your own cognitive profile sits — independent of any national average and reported as a domain-level score that reveals the shape of your profile — the RIOT gives you a precise, individualized measurement that a population figure can never provide.
References
World Population Review. (2026). Average IQ by Country 2026 — Hong Kong 107.73, South Korea 106.97, China 106.48. https://worldpopulationreview.com/country-rankings/average-iq-by-country Desperate Minds. (2026). Average IQ in China: 2026 Score & Full Data Ranking — 104–105 central estimate, 8–10 point urban-rural gap. https://www.desperateminds.com/blog/average-iq-china.html IQ Exam. (2025). Average IQ in China: 107.19 — Gaokao, East Asian cluster, and educational investment. https://iqexam.co/countries/china-average-iq IQ Career Lab. (2026). Average IQ in China: 106 (#2 Globally) — methodology notes and within-country caution. https://www.iqcareerlab.com/tools/iq-by-country/china DataPandas. (2026). Average IQ by Country — East Asian outliers and International IQ Test dataset methodology. https://www.datapandas.org/ranking/average-iq-by-country ScienceDirect / Heliyon. (2024). Regional inequality in China's educational development: An urban-rural comparison — EDL convergence 2003–2019. https://www.sciencedirect.com/science/article/pii/S2405844024022801 ScienceDirect / International Journal of Educational Development. (2023). Can improvements in teacher quality reduce the cognitive gap between urban and rural students in China? https://www.sciencedirect.com/science/article/abs/pii/S0738059323000573 PubMed Central. (2022). Urban-Rural Disparity in Cognitive Performance Among Older Chinese Adults: Explaining the Changes From 2008 to 2018. https://www.ncbi.nlm.nih.gov/pmc/articles/PMC8984104/
Take our professional IQ test
Want to know your IQ? Try the first ever professional online IQ test.
AuthorDr. Russell T. WarneChief Scientist
