What is test-retest reliability? Score stability across two testings
Test-retest reliability is the correlation between scores from two administrations of one test. On the WISC-V the corrected Full Scale IQ value is .92.
Dr. Russell T. WarneChief Scientist
Share
Test-retest reliability is the extent to which a test gives the same person the same score when it is administered twice. It is reported as a correlation between the two sets of scores, called a "stability coefficient," and it answers one narrow question: how much of the score would survive if the person sat the test again next month. On the fifth edition of the Wechsler Intelligence Scale for Children, the corrected stability coefficient for the Full Scale IQ is .92, while the individual index scores run as low as .75. That gap is the practical lesson of this page.
How a stability coefficient is produced
The 2014 Standards for Educational and Psychological Testing, published jointly by the American Educational Research Association, the American Psychological Association and the National Council on Measurement in Education, treats this as one of three broad families of reliability evidence. Coefficients come from administering alternate forms in separate sessions, from administering "the same form on separate occasions (test-retest coefficients)," or from the relationships among items within a single administration. A fourth kind of evidence, scorer consistency, is collected when scoring involves judgment.
The procedure for the second family is simple to describe. A sample of people takes the test, waits a defined interval, and takes it again. The two score sets are correlated. A coefficient of 1.0 would mean everyone kept their exact rank; 0 would mean the second testing told you nothing about the first.
Two design choices decide what the resulting number means.
• The interval: short intervals allow memory of the first sitting to carry over and inflate the correlation. Long intervals allow real change in the person, which deflates it. Neither is wrong, and each answers a different question.
• The sample: coefficients computed in a narrow-ability group run lower than the same coefficients computed in a nationally representative one, because a correlation shrinks when the range of scores shrinks. Publishers usually correct for this, and they say so.
The Standards flags the memory problem directly, noting that when the same form is used, "the correlation between the first and second scores could be inflated by the test taker's recall of initial responses."
What the Wechsler manuals report
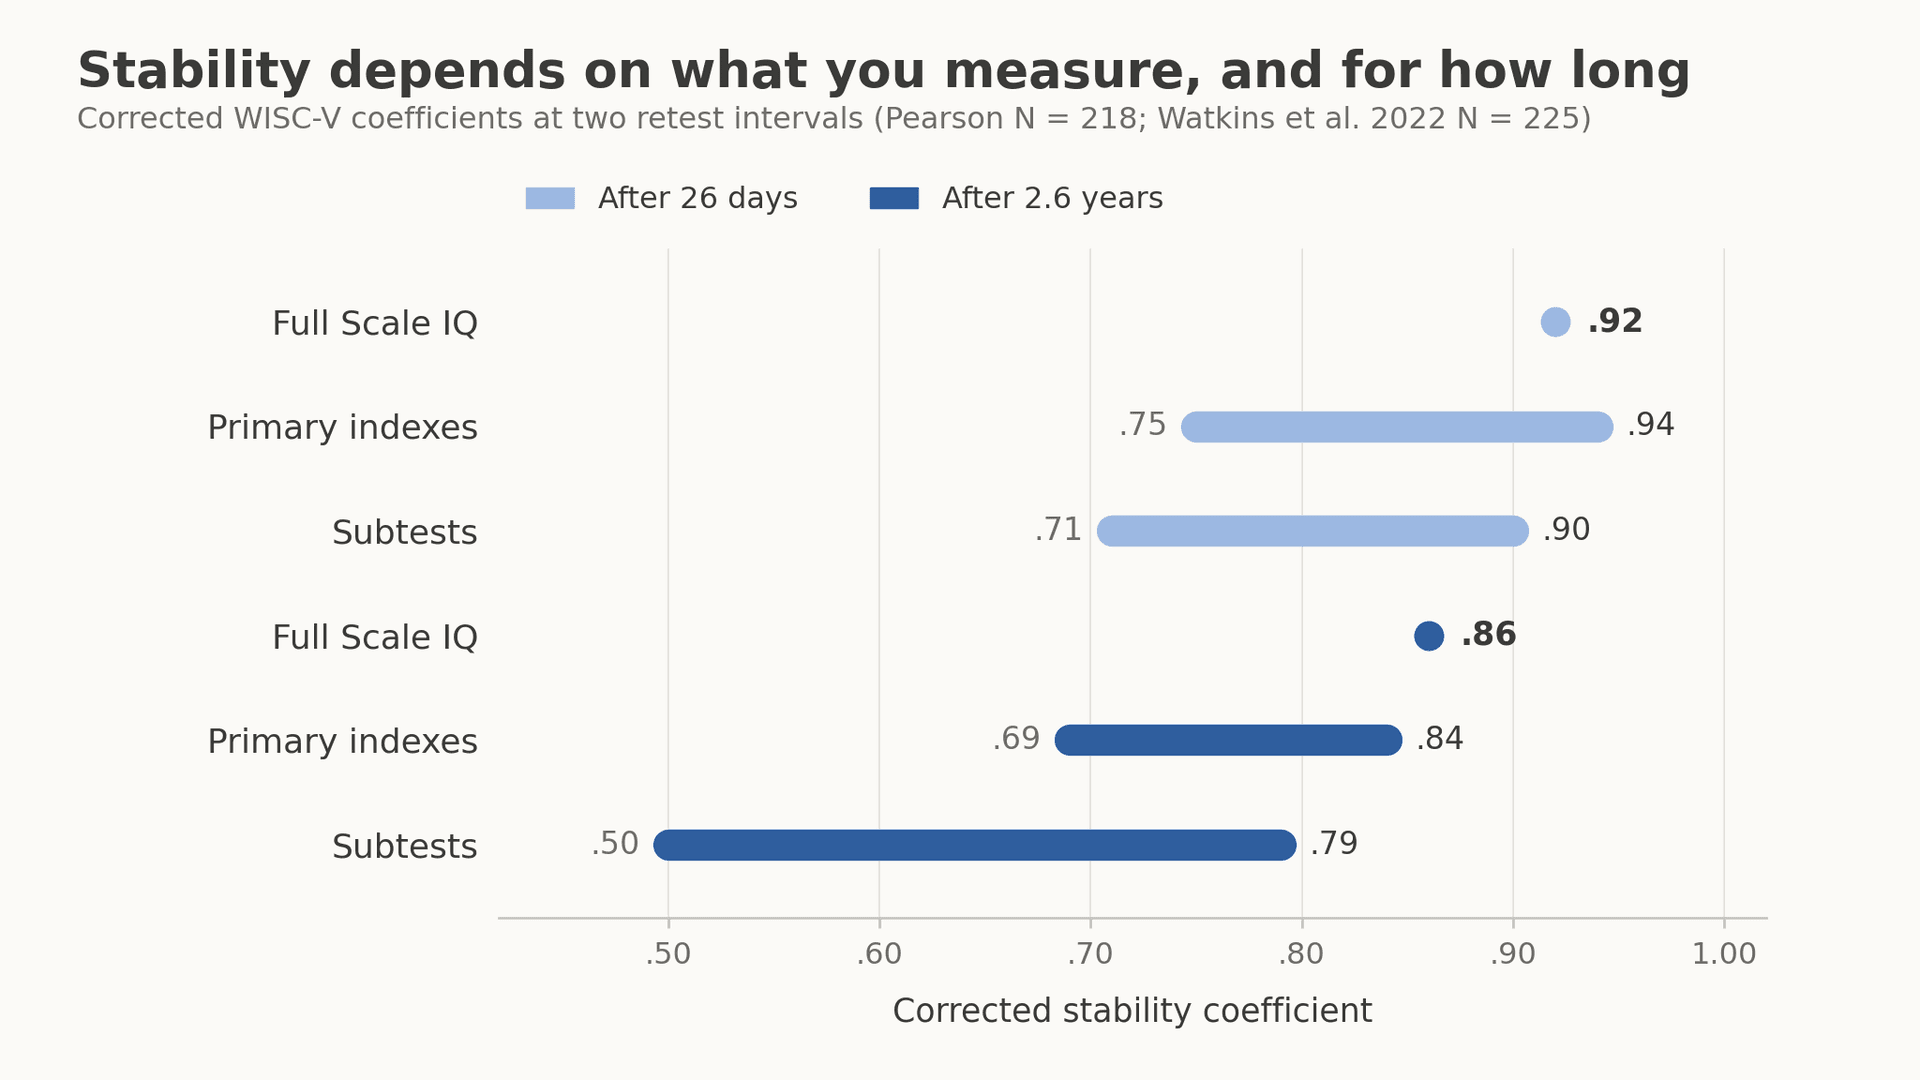
Pearson's technical documentation for the WISC-V describes a stability study in which 218 children in five age bands took the test twice. Retest intervals ran from 9 to 82 days, with a mean of 26 days. The corrected coefficient for the Full Scale IQ was .92. Corrected coefficients for the five primary index scores ranged from .75 to .94, and for individual subtests from .71 to .90. In the uncorrected figures reported by Miller and McGill, the Full Scale IQ sat at .91 while index scores ran from .68 to .91.
Read that spread carefully, because it is the single most useful thing on this page. The composite is stable. The parts are not equally stable. A Full Scale IQ pools seven subtests, so the random wobble in any one of them is partly cancelled by the others. A two-subtest index has no such protection, and a single subtest has none at all. The same logic governs the standard error of measurement, which is the score-scale expression of the same underlying precision.
The practical consequence is that a report showing a Full Scale IQ of 108 at both testings and a Processing Speed Index that moved from 95 to 108 has not shown a change in processing speed. It has shown the expected behavior of a less stable score. The Wechsler scales publish these coefficients precisely so that readers can hold that expectation.
The practice effect, and why the interval matters
Scores usually rise on a second administration. This is the "practice effect," and it is a property of the testing procedure rather than of the person's ability.
Scharfen, Peters and Holling pooled 122 studies covering 153,185 participants and found a retest effect from the first to the second administration of about a third of a standard deviation, with a 95% confidence interval from 0.28 to 0.38. On the familiar IQ metric, where the standard deviation is 15 points, a third of a standard deviation is roughly five points. The gain from the second testing to the third was about half as large, and the analysis found no further gains after the third administration. An earlier meta-analysis by Hausknecht and colleagues, covering 75 samples in selection settings, put simple repetition at almost a quarter of a standard deviation.
The same analysis pins down what the effect depends on.
• The form used: when the second administration used the identical form, the gain averaged 0.37 standard deviations. When it used an alternate form, the gain fell to 0.23, a statistically reliable difference. Some of what a retest measures is memory for particular items.
• The interval: the effect declined by about 0.0008 standard deviations per week, from an intercept of 0.34. That is a weak decay, and it implies that retest gains take years rather than months to disappear.
• The number of sittings: gains diminished sharply after the first repeat, from 0.33 for the first-to-second comparison to 0.17 for second-to-third, with nothing detectable beyond the third.
None of this makes a second score meaningless. It makes the second score a different measurement, taken under different conditions, and it is why clinicians treat a short-interval retest with caution. We cover the consumer side of that question separately, in our guide to the practice effect on IQ tests.
Short-interval stability is not long-term IQ stability
A 26-day coefficient describes the instrument. A multi-year coefficient describes something closer to the trait, and the two numbers are frequently confused.
Watkins and colleagues followed 225 children and adolescents seen at an outpatient neuropsychological clinic across an average test-retest interval of 2.6 years. Mean scores barely moved. Individual standings moved more. Subtest stability coefficients ran from .50 to .79 with a mean of .66. Primary index stability ran from .69 for Fluid Reasoning to .84 for Verbal Comprehension, averaging .77. The most stable score, again, was the Full Scale IQ at .86. Even so, 8.7% of Full Scale IQ scores changed by more than 15 points across the interval, and the corresponding figures for the index scores reached 16.1%.
Over much longer spans the picture is one of substantial but not perfect continuity. Deary, Whalley, Lemmon, Crawford and Starr retested 101 surviving members of the Scottish Mental Survey of 1932 at age 77 on the same Moray House Test they had taken at age 11. The correlation was .63, rising to .73 after correction for the restricted ability range of the volunteers who came back. Roughly half the variance in mental test scores at age 77 was shared with scores from 66 years earlier, which is a remarkable degree of continuity for any psychological measurement and still leaves a large share unaccounted for.
What a stability coefficient cannot tell you
A stability coefficient isolates one source of error. The Standards is explicit that "internal-consistency, alternate-form, and test-retest coefficients should not be considered equivalent, as each incorporates a unique definition of measurement error."
• It says nothing about whether the items cohere: that is the job of internal consistency, which is estimated from a single sitting.
• It says nothing about scorer agreement: where an examiner has to judge an open-ended answer, inter-rater reliability is a separate line of evidence.
• It says nothing about validity: a test can be beautifully stable and still measure the wrong thing, which is why construct validity is argued separately.
• It is a group statistic: a coefficient of .92 describes rank-order consistency in a sample. It does not promise that any particular person's score will repeat.
If you have two scores from the same instrument, the useful questions are how long the gap was, whether the same form was used, and whether the difference exceeds what measurement error alone would produce. Most score reports answer the last question with a confidence interval. A broader treatment of what reliability means for the consumer is in our article on how reliable IQ tests are.
For a current score from an instrument with published psychometric documentation, the Reasoning and Intelligence Online Test from RIOT IQ is a professionally developed IQ test for adults 18 and over, built to the same technical standards as proctored batteries. It does not replace an individually administered diagnostic evaluation.
Frequently asked questions
What is a good test-retest reliability coefficient?
For scores used in decisions about individuals, .90 and above is the usual expectation, and .80 is often treated as a floor. Published Full Scale IQ stability coefficients sit near .92 at short intervals. Research-only measures are commonly accepted at .70.
How long should the interval between testings be?
Long enough that memory of specific items has faded and short enough that the person has not genuinely changed. Wechsler stability studies use a few weeks; the WISC-V study averaged 26 days.
Why is my second IQ score higher than my first?
Most likely the practice effect. Meta-analytic estimates put the average first-to-second gain at about a third of a standard deviation, roughly five points on the IQ metric, with the gain shrinking as the interval lengthens.
Is test-retest reliability the same as internal consistency?
No. Test-retest reliability requires two administrations and captures error that varies across occasions. Internal consistency is computed from one administration and captures error arising from the sampling of items.
Do IQ scores stay stable through childhood?
Broadly, yes at the composite level. Across an average of 2.6 years, Full Scale IQ stability in one clinical sample was .86, while individual index scores fell as low as .69 and subtests as low as .50.
Why is Full Scale IQ more stable than any single index?
Because it aggregates more subtests. Independent fluctuations in the parts partly cancel when they are pooled, so the composite carries less measurement error than any of its components.
References
1. American Educational Research Association, American Psychological Association, & National Council on Measurement in Education. (2014). Standards for educational and psychological testing. AERA. testingstandards.net
2. Pearson. (2018). Efficacy research report: WISC-V. Pearson. pearson.com
3. Miller, D. C., & McGill, R. J. (2016). Review of the WISC-V. In A. S. Kaufman, S. E. Raiford, & D. L. Coalson (Eds.), Intelligent testing with the WISC-V (pp. 645-662). Wiley. rjmcgill.com
4. Watkins, M. W., Canivez, G. L., Dombrowski, S. C., McGill, R. J., Pritchard, A. E., Holingue, C. B., & Jacobson, L. A. (2022). Long-term stability of Wechsler Intelligence Scale for Children-Fifth Edition scores in a clinical sample. Applied Neuropsychology: Child, 11(3), 422-428. doi.org
5. Deary, I. J., Whalley, L. J., Lemmon, H., Crawford, J. R., & Starr, J. M. (2000). The stability of individual differences in mental ability from childhood to old age: Follow-up of the 1932 Scottish Mental Survey. Intelligence, 28(1), 49-55. doi.org
6. Scharfen, J., Peters, J. M., & Holling, H. (2018). Retest effects in cognitive ability tests: A meta-analysis. Intelligence, 67, 44-66. doi.org
7. Hausknecht, J. P., Halpert, J. A., Di Paolo, N. T., & Moriarty Gerrard, M. O. (2007). Retesting in selection: A meta-analysis of coaching and practice effects for tests of cognitive ability. Journal of Applied Psychology, 92(2), 373-385. doi.org
Figure: original illustration created for RIOT IQ, plotting the corrected stability coefficients reported in Pearson's WISC-V technical documentation (N = 218) and in Watkins and colleagues (2022, N = 225). It is not a reproduction of any published figure.
Take our professional IQ test
Want to know your IQ? Try the first ever professional online IQ test.