Classical test theory: the model behind most published test scores
Classical test theory treats an observed test score as a true score plus random error, X = T + E. Here is the model, its key statistics and its limits.
Dr. Russell T. WarneChief Scientist
Share
Classical test theory is the statistical framework that treats a person's observed test score as the sum of two quantities that cannot be seen directly: a "true score" standing for the person's actual level on whatever the test measures, and an "error score" standing for everything random that pushed the observed result away from it. In symbols it is X = T + E, read as observed score equals true score plus error. The 2014 Standards for Educational and Psychological Testing defines it in almost those words, as a theory "based on the view that an individual's observed score on a test is the sum of a true score component for the test taker and an independent random error component."
Almost every reliability coefficient and standard error printed in an intelligence-test manual comes out of this model. This page covers the assumptions, the statistics the model produces, why those statistics belong to the sample they were computed in, and where the framework runs out. How large the error term is and how to report it is a separate subject, covered in our explainer on the standard error of measurement.
The model, and the assumptions that make it solvable
X = T + E has two unknowns for every examinee, so on its own it cannot be solved. Hambleton and Jones, in the instructional module the National Council on Measurement in Education still distributes, set out the three assumptions that close the gap: true scores and error scores are uncorrelated, the average error score in the population is zero, and error scores on parallel tests are uncorrelated.
"Parallel forms" are tests that cover the same content, on which each examinee has the same true score, and whose errors of measurement are the same size. That definition gives the true score its operational meaning: the Standards glossary describes it as the average of the scores a person would earn on an unlimited number of strictly parallel forms.
From those premises comes most of the arithmetic in a psychometrics textbook. Ross Traub's history traces the development to the early twentieth century, with Charles Spearman's 1904 paper on the measurement of association the usual starting point and Melvin Novick's 1966 paper giving the axioms their modern formal statement. Hambleton and Jones call classical models "weak models" because their assumptions are easy for real data to satisfy, a practical virtue: a model that almost never fails to fit needs no goodness-of-fit study first.
Reliability is a ratio of variances
Within classical test theory, reliability is the share of the differences among people's observed scores that comes from real differences in their true scores rather than from noise. As a formula, reliability equals true-score variance divided by observed-score variance. Because true scores are never seen, it is estimated indirectly, most often as the correlation between scores on two equivalent forms.
The Standards is precise about the vocabulary. It reserves "reliability coefficient" for the coefficients of classical test theory specifically, and uses the broader "reliability/precision" for consistency across replications of a testing procedure however that is expressed. Standard 2.6 warns that internal-consistency, alternate-form and test-retest coefficients are not interchangeable, because each treats a different thing as error. Our page on internal consistency covers how one of those families is estimated.
Published batteries show what the coefficients look like. Miller and McGill's review of the WISC-V reports internal consistency for Full Scale IQ between .96 and .97 across the eleven age groups, with subtest coefficients from .81 to .94; Canivez's review of the WAIS-IV reports .97 to .98 for Full Scale IQ. On the public-domain International Cognitive Ability Resource (ICAR), Condon and Revelle report alpha of .93 for the 60-item set and .68 for its eleven matrix reasoning items alone. The Standards set no numeric threshold; the rules of thumb about .80 for research use and .90 for individual decisions are textbook conventions rather than requirements.
Spearman's correction for attenuation belongs here too. It estimates what two variables would correlate if both were measured without error, by dividing the observed correlation by the square root of the product of the two reliabilities.
The classical item statistics: p and r
Classical test theory is mostly a theory about whole test scores rather than about individual items. It does supply two item statistics, and they have carried the item-selection work of test construction for a century.
• Item difficulty, denoted p: The proportion of the sample who answered the item correctly. The label is counter-intuitive, because a high p marks an easy item. Condon and Revelle's data give the spread on real reasoning items: across 96,958 participants from 199 countries, the easiest verbal reasoning item was answered correctly by 96 percent and the hardest three-dimensional rotation item by 8 percent, with a weighted mean across all 60 items of .53. Mean difficulty by item type ranged from .19 for three-dimensional rotation to .64 for verbal reasoning.
• Item discrimination, denoted r: The correlation between performance on the item and the total test score, which indexes how well the item separates stronger examinees from weaker ones. The point-biserial correlation is the simplest version; the biserial correlation is often preferred because it varies less across examinee samples.
A poor item here is one whose p value is too high or too low, or whose correlation with the total score is low. Samples of roughly 200 to 500 examinees are generally enough to calibrate the statistics, a real advantage during field testing, and the whole procedure runs on nothing more exotic than counts of correct answers.
Why classical statistics belong to their sample
This is the framework's defining limitation, and it cuts in two directions at once.
On the item side, p and r are properties of an item-and-sample pair rather than of the item. Hambleton and Jones state the pattern plainly: discrimination indices come out higher in heterogeneous examinee samples and lower in homogeneous ones, while difficulty values come out higher in samples of above-average ability and lower in samples of below-average ability. An item is never easy in the abstract. It was easy for the group that took it. The ICAR difficulty values above came from a self-selected online sample with a median age of 22, and would shift in a census-matched sample of adults.
On the person side, observed scores and estimated true scores are properties of a person-and-test pair. Frederic Lord made the point in 1953, and Hambleton and Jones open their module with it: examinees have lower true scores on difficult tests and higher true scores on easy ones even though their underlying ability has not changed. Classical test theory has no parameter for that underlying ability, so it cannot compare two people who sat different sets of items.
If an instrument's statistics are sample-bound, the sample has to be chosen with great care, which is why publishers spend heavily on stratified norming studies and why we have a whole page on why the norm sample matters for accuracy.
Where classical test theory stops
Three consequences of the model's test-level focus mark the boundary of what it can do, and each is where item response theory takes over.
• One error estimate for a whole scale: A single standard error of measurement is an average across a reference population, and precision is not constant across the score range. The Standards treat conditional standard errors at several score levels as a reporting obligation where feasible, and note that item response theory supplies a way to estimate them.
• No statement about any particular item: The true-score model, in Hambleton and Jones's phrase, "permits no consideration of examinee responses to any specific item," so there is no basis for predicting how a given examinee will handle a given question.
• Persons and items on different scales: Difficulty is a proportion of a sample, ability a number-correct score. Nothing places the two on a common metric, which is why computerized adaptive testing, where every examinee sees a different set of items, is out of reach without a different model.
Item response theory addresses all three by modeling the probability of a correct response to each item as a nonlinear function of a latent ability, at the cost of stronger assumptions, calibration samples above 500 and a real risk of model misfit. That does not retire the older framework. Hambleton and Jones note that thousands of excellent tests were built classically, including every important test up to the end of the 1960s, and that classical analyses remain cheaper and more robust. Many testing programs use both.
When you read a score, then, the numbers in the technical documentation are conditional on the people the test was tried out on. A trustworthy instrument publishes its reliability coefficients, the samples they came from and the standard error that follows, which is part of what separates a documented assessment from an unnormed quiz. The Reasoning and Intelligence Online Test was built on that basis, and readers wanting a professionally developed IQ test can take one.
Frequently asked questions
What does X = T + E actually mean?
The score a person obtains is treated as their stable true level on the measured attribute plus a random deviation on that occasion. Neither component on the right is observed. The model exists to let the size of the second one be estimated across a population.
Is classical test theory obsolete?
No. Its assumptions are easy to satisfy, its statistics can be estimated from samples of a few hundred, and it underpins the reliability figures in current editions of the major cognitive batteries. It is limited rather than wrong, and often used alongside item response theory.
How is classical test theory different from item response theory?
Classical test theory is a linear model of whole test scores whose item and person statistics depend on the sample and the test. Item response theory is a nonlinear model of individual item responses which, when it fits, yields item statistics independent of the sample and ability estimates independent of the particular items administered.
Why does the same item have different difficulty values in different studies?
Because classical item difficulty is the proportion of a specific sample that answered correctly. A more able sample produces a higher value for the identical item. This is the most consequential limitation of the framework.
References
1. American Educational Research Association, American Psychological Association, & National Council on Measurement in Education. (2014). Standards for educational and psychological testing. AERA. testingstandards.net
2. Hambleton, R. K., & Jones, R. W. (1993). An NCME instructional module on comparison of classical test theory and item response theory and their applications to test development. Educational Measurement: Issues and Practice, 12(3), 38-47. ncme.org
3. Novick, M. R. (1966). The axioms and principal results of classical test theory. Journal of Mathematical Psychology, 3(1), 1-18. doi.org
4. Traub, R. E. (1997). Classical test theory in historical perspective. Educational Measurement: Issues and Practice, 16(4), 8-14. winsteps.com
5. Spiegelman, D. (2010). Commentary: Some remarks on the seminal 1904 paper of Charles Spearman "The proof and measurement of association between two things". International Journal of Epidemiology, 39(5), 1156-1159. pmc.ncbi.nlm.nih.gov
6. Condon, D. M., & Revelle, W. (2014). The International Cognitive Ability Resource: Development and initial validation of a public-domain measure. Intelligence, 43, 52-64. personality-project.org
7. Miller, D. C., & McGill, R. J. (2016). Review of the WISC-V. In A. S. Kaufman, S. E. Raiford, & D. L. Coalson (Eds.), Intelligent testing with the WISC-V (pp. 645-662). Wiley. rjmcgill.com
8. Canivez, G. L. (2010). Review of the Wechsler Adult Intelligence Scale-Fourth Edition. In R. A. Spies, J. F. Carlson, & K. F. Geisinger (Eds.), The eighteenth mental measurements yearbook. Buros Center for Testing. ux1.eiu.edu
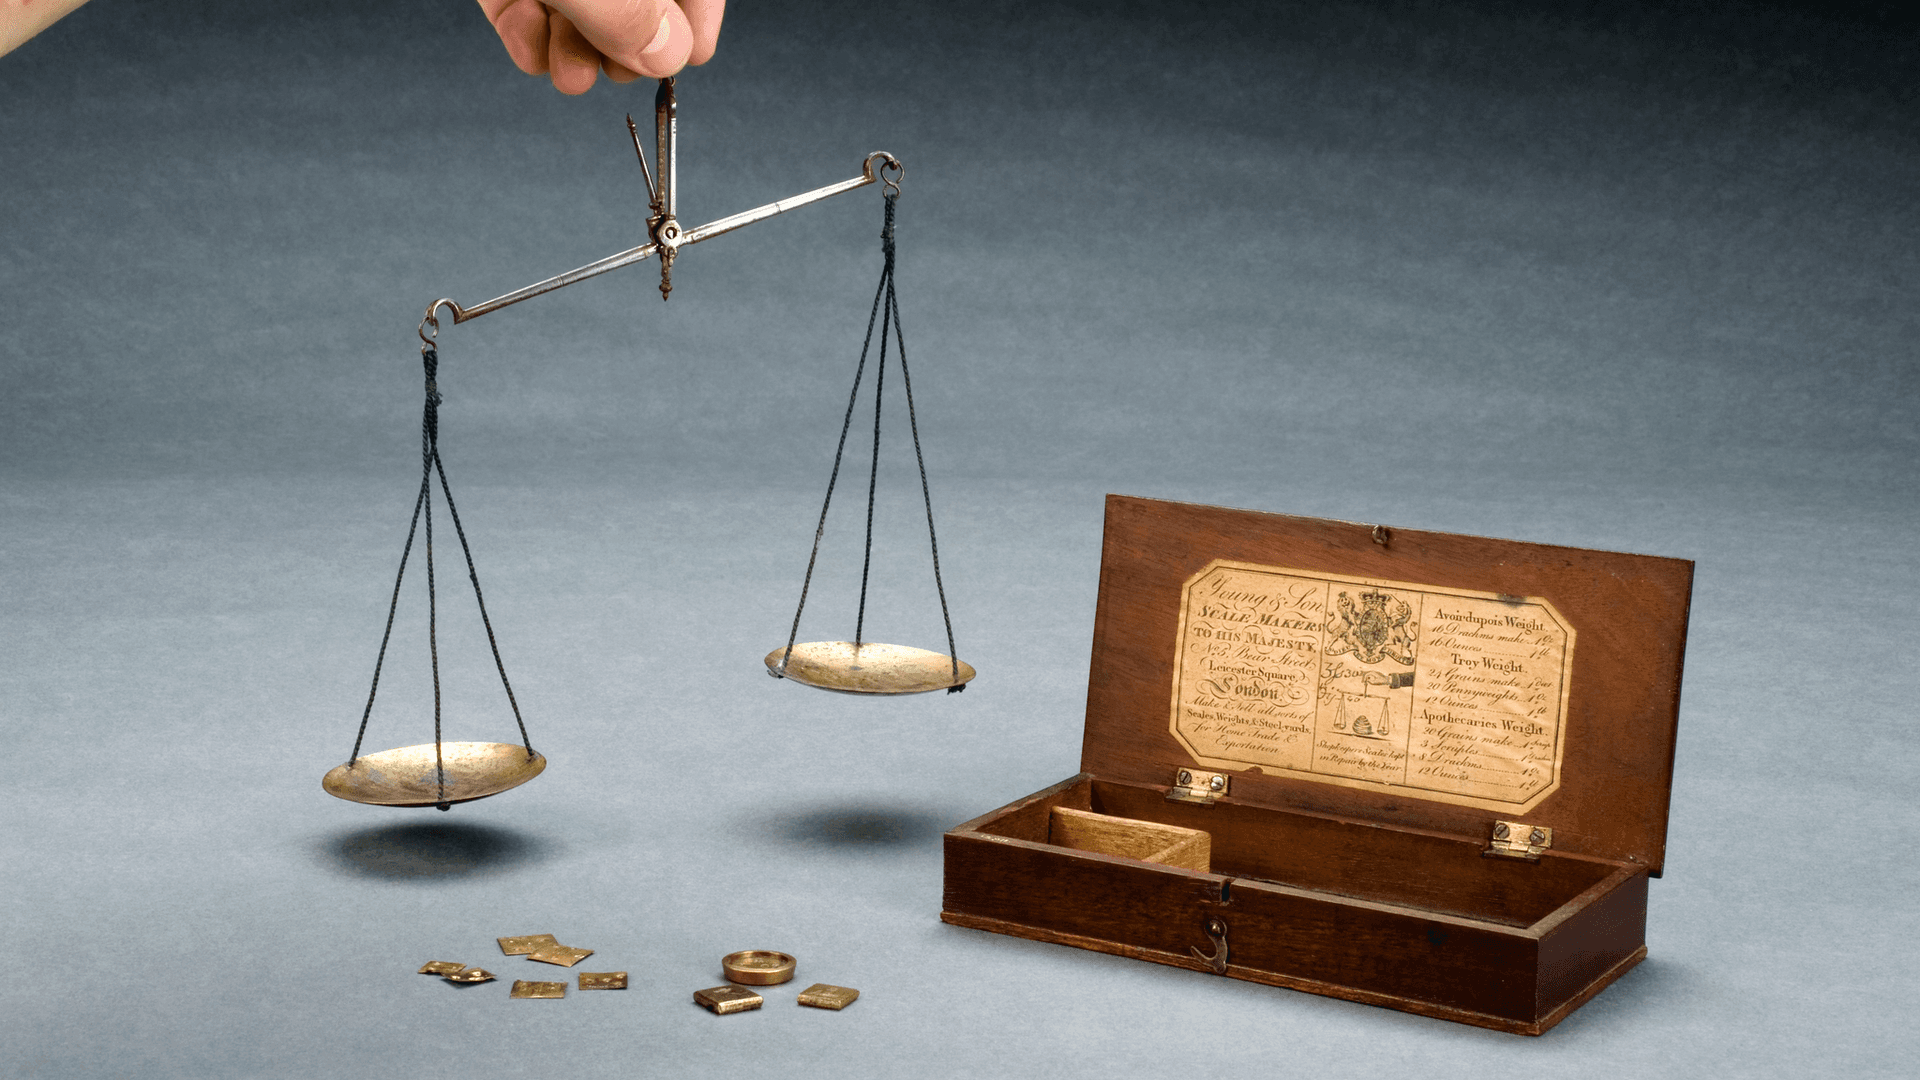
Hero image: apothecary's balance with steel beam and brass pans, Young and Son, London, from Wellcome Collection, licensed CC BY 4.0 (creativecommons.org/licenses/by/4.0). Via Wikimedia Commons.
Take our professional IQ test
Want to know your IQ? Try the first ever professional online IQ test.