Item response theory: how a test models one item at a time
Item response theory models the chance of a correct answer as a function of ability, one item at a time, using difficulty, discrimination and guessing.
Dr. Russell T. WarneChief Scientist
Share
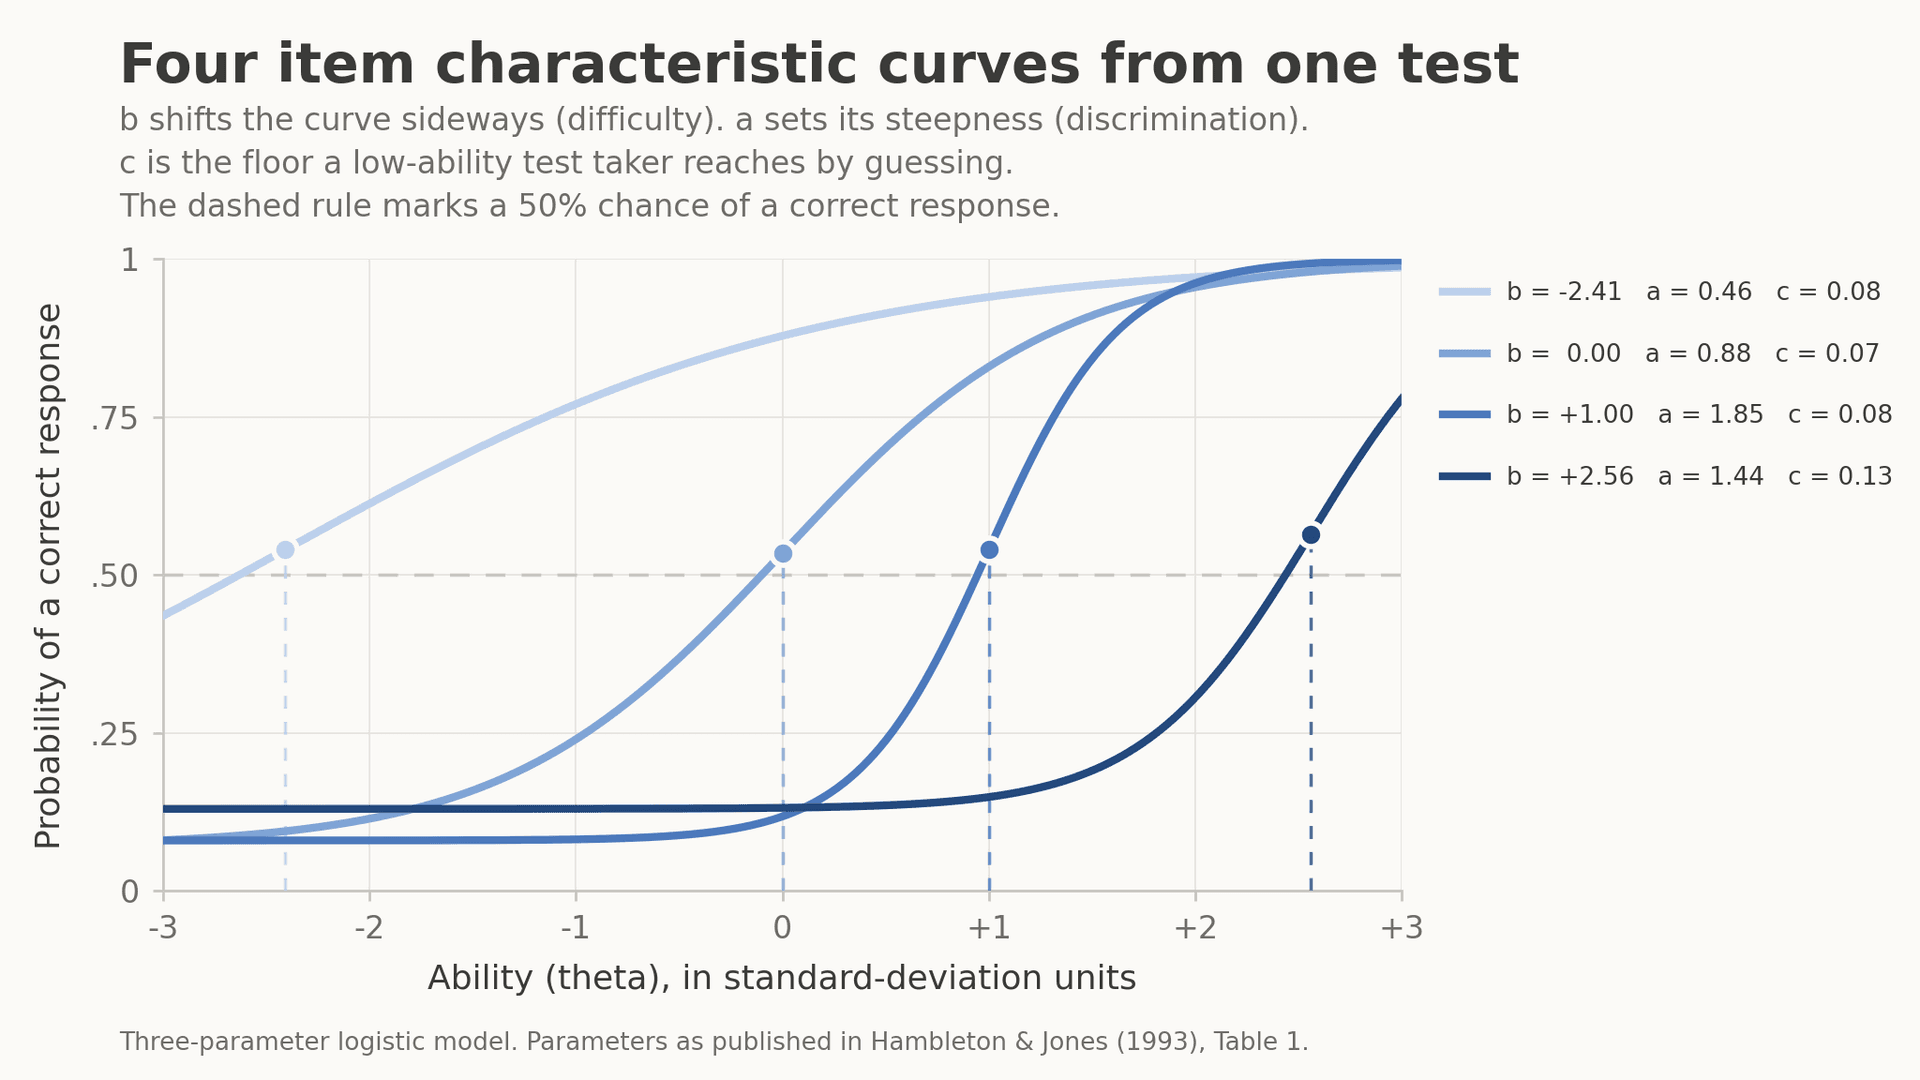
Item response theory, usually shortened to IRT, is a family of statistical models giving the probability of a particular answer to a single test item as a function of the test taker's standing on the trait that item measures. The 2014 Standards for Educational and Psychological Testing defines it as "a mathematical model of the functional relationship between performance on a test item, the test item's characteristics, and the test taker's standing on the construct being measured." Plot that probability against ability and you get the object the framework is built around, an S-shaped "item characteristic curve."
This page covers the curve, the parameters that shape it, the one-, two- and three-parameter models with the Rasch model as the one-parameter case, information functions, and the invariance property that repays the trouble.
The item characteristic curve
Start with the person. IRT represents each test taker by one number for the trait measured, written as the Greek letter theta and called the "ability parameter," which the Standards glossary describes as "a theoretical value indicating the level of a test taker on the ability or trait measured by the test." By convention theta is scaled to a mean of 0 and a standard deviation of 1 in the calibration sample, so nearly everyone falls between -3 and +3. Its unit is the "logit."
Now the item. For any value of theta, the model returns a probability between 0 and 1 that a person at that level answers this item correctly. Sweep theta across its range, plot the probabilities, and the result is the item characteristic curve, or ICC, which the Standards describe as the model used "to represent the increasing proportion of correct responses to an item at increasing levels of the ability or trait being measured." It rises and never falls, encoding the assumption that more of the trait never makes an item harder.
Items and people sit on the same scale, so it is meaningful to say an item's difficulty is 1.2 and a person's ability is 0.4. Theta is estimated from the responses combined with the calibrated item parameters rather than counted, which makes it a different currency from a raw score or a scaled score.
The price is a strong assumption. The common models assume a single trait accounts for performance across the items, which is why they sit most comfortably on measures of general reasoning of the kind discussed on our page about the g factor. Hambleton and Jones call them "strong models" for that reason.
The three item parameters
A curve's shape is fixed by up to three numbers per item, conventionally labeled b, a and c.
• b, difficulty: The point on the ability scale where the curve reaches the midpoint of its rise, formally where the probability of success equals (1 + c)/2. A larger b means a harder item, and b uses the same logit units as theta, so an item with b = 1.5 is aimed well above average.
• a, discrimination: A quantity proportional to the slope of the curve at b. A steep curve sorts people sharply over a narrow band of ability; a flat curve distinguishes weakly across a wide one.
• c, pseudo-guessing: The height of the curve's lower floor, the probability that someone with very little of the trait still answers correctly. It accommodates multiple-choice formats and is unnecessary for free-response items.
Published values make this concrete. Antoniou and colleagues fitted models of up to four parameters to Raven's Coloured Progressive Matrices in 1,127 Greek children aged 5 to 11. Mean item difficulty came out at -1.04 logits for Form A, -0.09 for Form AB and +0.21 for Form B, recovering the intended ordering of the forms from response data alone. Mean pseudo-guessing estimates fell across the same sequence, from 0.233 to 0.164 to 0.093, against the 1 in 6 chance level (about 0.167) of a six-option matrix item. Every information criterion they examined favored the three-parameter model, as did Bürkner's reanalysis of 499 adults' responses to the hardest twelve Standard Progressive Matrices items.
One, two and three parameters, and the Rasch model as the 1PL
The three common models for right-or-wrong items are nested. The three-parameter logistic model, 3PL, estimates b, a and c. Fix c at 0 and the two-parameter model, 2PL, remains. Fix c at 0 and a at 1 and what remains is the one-parameter model, 1PL, the Rasch model.
Rasch deserves its own paragraph because it is a distinct research tradition rather than only a special case. Georg Rasch published the model in 1960, and Benjamin Wright's account states the appeal plainly: each person gets one ability number, each item one difficulty number, and the probability of a correct answer depends on nothing except the difference between them. In words, the odds of a correct response equal the constant e raised to the power of ability minus difficulty, and the probability is those odds divided by one plus those odds. Where ability equals difficulty, the probability is 0.5. Practitioners here treat a misfitting item as an item to revise rather than a reason to add parameters.
That matters for cognitive assessment, because one major battery family has been built this way for half a century. Richard Woodcock was introduced to Rasch measurement in 1969 and has calibrated cognitive test items with it since 1970, and the Woodcock-Johnson W scale is the result: a Rasch-derived metric on which, as Schrank puts it, "item difficulties and ability scores are on the same scale." That is what lets the battery report how proficient a person is at tasks of a stated difficulty rather than only where they rank. Kajanová and colleagues used the same machinery on the Czech WJ IV cognitive battery, where 0.5 logits was the criterion adopted at standardization, and the Stanford-Binet 5 reports a criterion-referenced metric in the same spirit, its optional change-sensitive scores, on a scale centered near 500. Hambleton and Jones note the trade-off: the 1PL is the easiest of the three to apply, and its assumptions the most likely to be violated.
Information functions, or where a test actually measures well
IRT replaces a single reliability figure for a whole test with a function that varies along the ability scale. An "item information function" shows how much one item contributes to precision at each level of theta. Items do their best work near their own b value, and sharper items contribute more.
Summing those functions gives the "test information function," whose payoff is a formula for precision at any ability: the standard error of the ability estimate equals 1 divided by the square root of the test information there. More information means smaller error, computed where the person actually sits rather than averaged over everyone. The Standards glossary defines it as a function relating each level of a latent trait "to the reciprocal of the corresponding conditional measurement error variance."
Condon and Revelle's table for the 16-item International Cognitive Ability Resource shows how uneven this is. Their verbal reasoning item VR.04 supplies 0.49 units of information at a theta of -1 and only 0.04 at a theta of +2, so it is informative about below-average reasoners and close to useless for strong ones. Letter and number series item LN.58 peaks higher up, at 0.43 around 0 and 0.32 at +1.
This is the machinery behind the conditional standard errors the Standards ask publishers to report at several score levels, and the reason a test supporting a decision at an extreme score needs items calibrated out there. Our page on the standard error of measurement covers how that error is expressed in IQ points.
Invariance, and what item response theory buys
The property that justifies the extra difficulty is parameter invariance. Because an ICC gives the probability of success at each ability level, it does not depend on how many people in a group sit at each level. Hambleton and Jones illustrate this with two groups of differing ability sharing one identical curve, then note that classical statistics on that same item would make it look easier and more discriminating in the abler group. Item parameters therefore do not depend on the ability distribution of the calibration sample, and ability estimates do not depend on which items a person was given. Both hold only to the extent that the model fits.
Several capabilities follow. Scores from different forms can be placed on one scale. An adaptive test can choose whichever untaken item carries the most information at the current estimate, which is how a short test reaches the precision of a long one. Conditional standard errors can be computed anywhere on the scale, and differential item functioning can be examined by comparing curves across groups matched on ability. The costs are real: calibration generally wants samples above 500, and model fit can fail, particularly around dimensionality.
Set against classical test theory, which models whole test scores under weak assumptions with sample-bound item statistics, IRT models individual responses under strong assumptions with sample-free parameters. Neither has displaced the other and many testing programs use both. The question worth asking of any published score is whether the publisher documents how its items were calibrated and how precise the score is at the level obtained. Readers wanting an online IQ test built by psychometricians with that documentation available can take one.
Frequently asked questions
What does theta mean in item response theory?
Theta is the model's estimate of a person's level on the trait measured. It is scaled to a mean of 0 and a standard deviation of 1 in the calibration sample, so values run from roughly -3 to +3, in units called logits.
Is the Rasch model the same as the one-parameter logistic model?
Mathematically, yes: discrimination is fixed equal across items and there is no guessing parameter. The labels carry different traditions, and Rasch practitioners treat departures from the model as a signal to improve the items.
Do real IQ tests use item response theory?
Some do, extensively. The Woodcock-Johnson batteries have been Rasch-calibrated since the 1970s and report the Rasch-derived W scale, and the Stanford-Binet 5 offers change-sensitive scores on a comparable metric. Reliability reporting for the Wechsler scales remains largely classical.
Why stop at three parameters?
A fourth can be added for a ceiling below 1, representing capable test takers who answer carelessly. Antoniou and colleagues tested it on Raven's Coloured Progressive Matrices and found it unnecessary, with carelessness negligible.
References
1. American Educational Research Association, American Psychological Association, & National Council on Measurement in Education. (2014). Standards for educational and psychological testing. AERA. testingstandards.net
2. Hambleton, R. K., & Jones, R. W. (1993). An NCME instructional module on comparison of classical test theory and item response theory and their applications to test development. Educational Measurement: Issues and Practice, 12(3), 38-47. ncme.org
3. Wright, B. D. (1977). Solving measurement problems with the Rasch model. Journal of Educational Measurement, 14(2), 97-116. rasch.org
4. Antoniou, F., Alkhadim, G., Mouzaki, A., & Simos, P. (2022). A psychometric analysis of Raven's Coloured Progressive Matrices: Evaluating guessing and carelessness using the 4PL item response theory model. Journal of Intelligence, 10(1), 6. pmc.ncbi.nlm.nih.gov
5. Bürkner, P.-C. (2020). Analysing Standard Progressive Matrices (SPM-LS) with Bayesian item response models. Journal of Intelligence, 8(1), 5. pmc.ncbi.nlm.nih.gov
6. Condon, D. M., & Revelle, W. (2014). The International Cognitive Ability Resource: Development and initial validation of a public-domain measure. Intelligence, 43, 52-64. personality-project.org
7. Schrank, F. A. (2010). Woodcock-Johnson III Tests of Cognitive Abilities. In A. S. Davis (Ed.), Handbook of pediatric neuropsychology (Chapter 31). Springer. iapsych.com
8. Kajanová, A., Urbánek, T., Mrhálek, T., Ondrášek, S., Shivairová, O., & Hynek, J. (2021). Item analysis of the Czech version of the WJ IV COG battery from a group of Romani children. International Journal of Environmental Research and Public Health, 18(19), 10518. pmc.ncbi.nlm.nih.gov
9. Roid, G. H. (2016). Stanford-Binet Intelligence Scales, Fifth Edition: Online Scoring and Report System user's guide. PRO-ED. proedinc.com
10. Woodcock, R. W. (1998). Rasch and the Woodcock tests. Rasch Measurement Transactions, 12(3), 649. rasch.org
Figure by Riot IQ. Three-parameter logistic model plotted from the item parameters published in Hambleton and Jones (1993), Table 1.
Take our professional IQ test
Want to know your IQ? Try the first ever professional online IQ test.