Response to intervention: how schools decide a student needs more help
Response to intervention is a tiered school framework that screens every student, intervenes with those falling behind, and measures whether they catch up.
Dr. Russell T. WarneChief Scientist
Share
Response to intervention (RTI) is a framework in which a school screens every student, gives progressively more intensive instruction to those who fall behind, and uses their measured response to that instruction to decide who needs something more. Its defining move is procedural rather than diagnostic: instead of testing a struggling child to find out why, the school changes the instruction first and watches what happens.
Before 2004, most states identified a learning disability by looking for a severe gap between a child's IQ score and achievement. Federal regulation now forbids states from requiring that gap and requires them to permit an RTI-based process instead, which our article on how dyscalculia is diagnosed covers in detail. This page takes RTI on its own terms.
What response to intervention is, and how it differs from MTSS
Federal special education regulation never uses the phrase "response to intervention" as a defined term. What 34 CFR §300.307(a) says is that a state's criteria for identifying a specific learning disability "must not require the use of a severe discrepancy between intellectual ability and achievement" and "must permit the use of a process based on the child's response to scientific, research-based intervention." RTI is the name practitioners gave that process.
"Multi-tiered system of supports" (MTSS) is the broader term, and it does have a statutory definition. Under the Every Student Succeeds Act, at 20 U.S.C. §7801(33), MTSS means "a comprehensive continuum of evidence-based, systemic practices to support a rapid response to students' needs, with regular observation to facilitate data-based instructional decisionmaking." MTSS covers academics, behavior and often social-emotional supports in one architecture, while RTI usually names the academic strand and carries the extra freight of its role in eligibility. Schools use the words interchangeably, which is imprecise but rarely consequential.
The tiers, and the proportions you cannot source
Tier 1 is the core instruction every student receives. Tier 2 adds targeted small-group instruction for students who screen below benchmark, typically three to five times a week for 20 to 40 minutes. Tier 3 is the most intensive level, generally daily and in smaller groups, for students who show minimal progress in Tier 2.
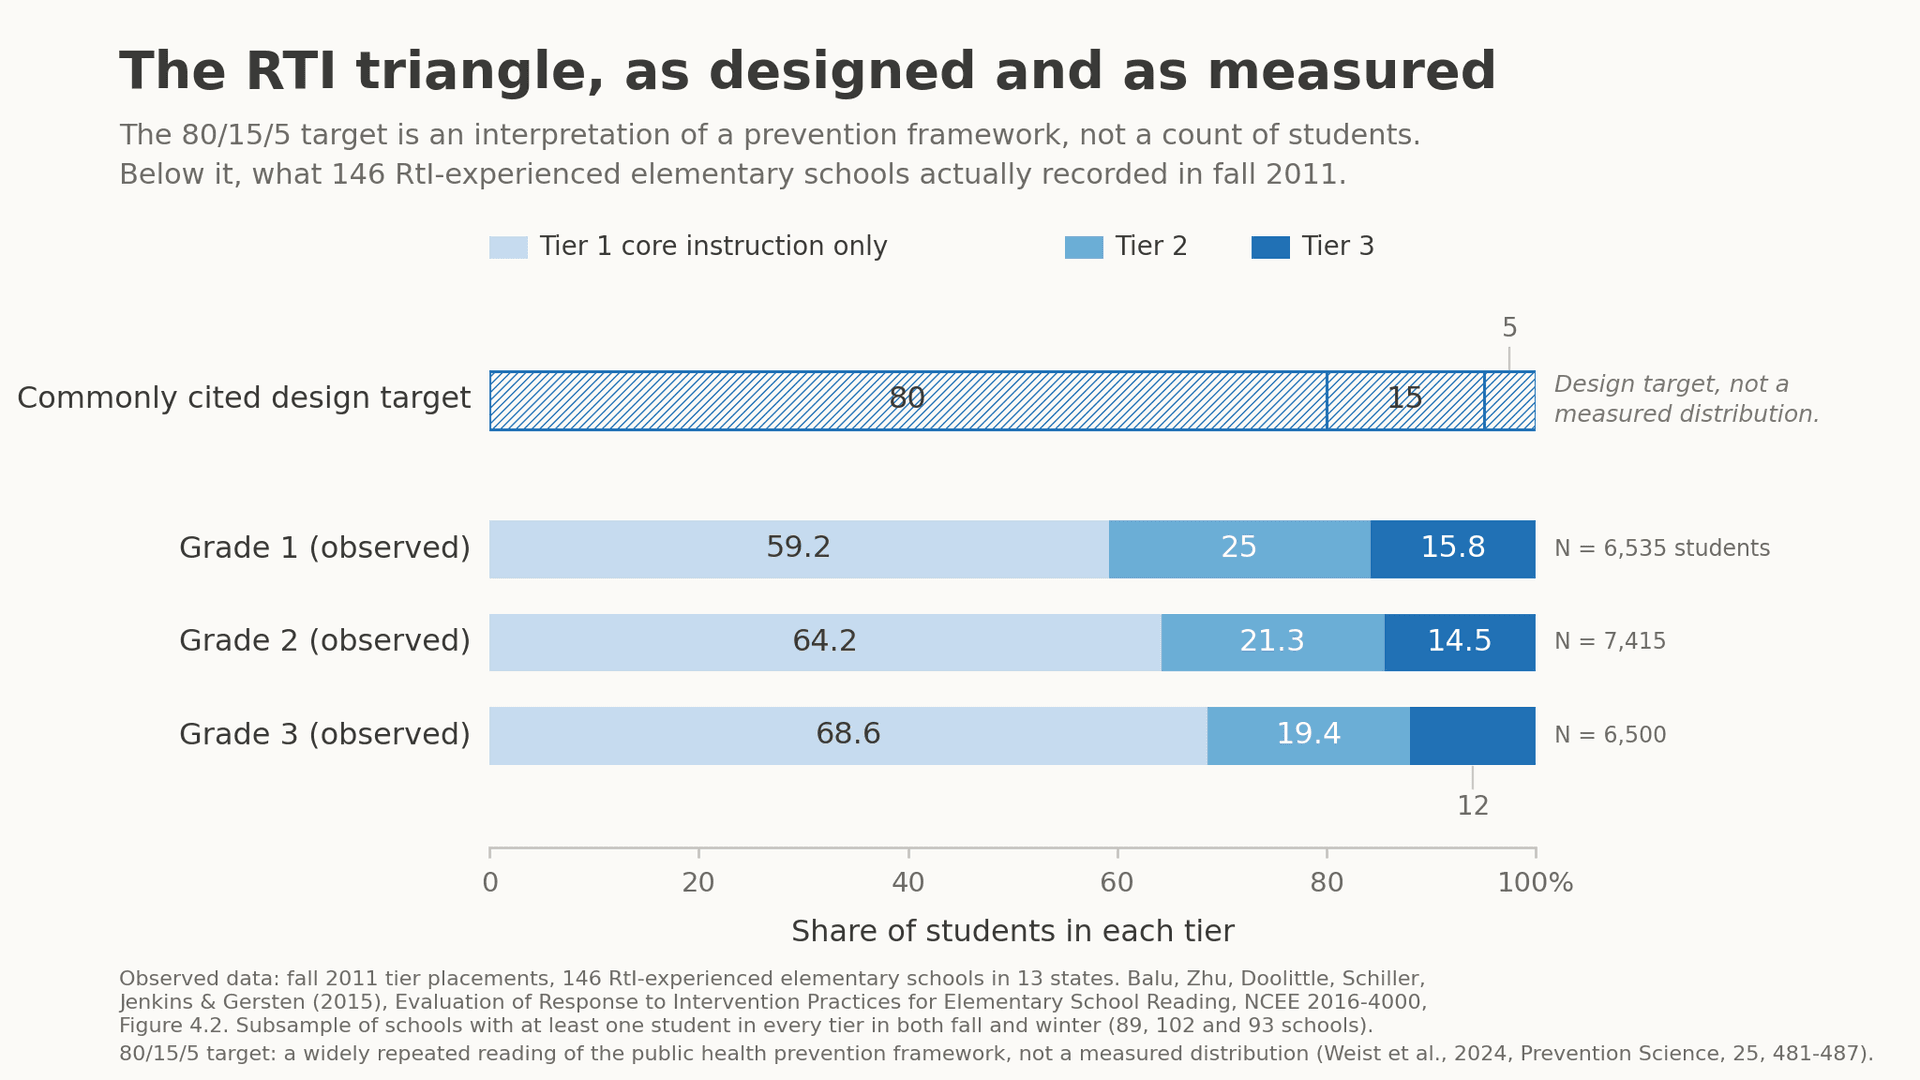
Almost every presentation of this framework shows a triangle labelled 80 percent, 15 percent and 5 percent. Those numbers are not a measured distribution. Weist and colleagues traced them to the public health prevention model imported into schools through positive behavioral interventions and supports, and concluded that the Tier 3 projection "remains an interpretation of the public health framework" rather than an empirical finding. The federal government's own RTI evaluation prints the triangle and then notes that its numbers "are hypothetical and are not based on actual data from this study."
What that evaluation does report is the real thing. Across 146 elementary schools in 13 states already experienced with RTI, fall 2011 placements ran as follows.
• Grade 1: Of 6,535 students, 59.2 percent were in Tier 1 only, 25.0 percent in Tier 2 and 15.8 percent in Tier 3. Four students in ten were receiving intervention.
• Grade 2: Of 7,415 students, 64.2, 21.3 and 14.5 percent respectively.
• Grade 3: Of 6,500 students, 68.6, 19.4 and 12.0 percent.
The machinery: universal screening and progress monitoring
Two measurement operations carry the framework. The first is universal screening, usually a brief group-administered measure given two or three times a year. (Schools also screen to find students for enrichment, as our article on how gifted testing works describes.) The federal practice guide rates the evidence for screening and progress monitoring as "moderate," because most underlying studies are correlational and lack cross-validation.
The accuracy figures are sobering. Catts and colleagues examined screening data on 18,667 Florida children who began kindergarten in 2003-04. Fixing sensitivity at .90, so that nine in ten eventually poor readers are caught, the September kindergarten initial-sound fluency measure produced a false-positive rate of .86, and letter-naming fluency by the end of kindergarten still produced .55. The authors noted that "in most RTI frameworks a false positive rate of a 50% or less would seem acceptable."
The second operation is progress monitoring, usually repeated one-minute oral reading probes from which a growth slope is estimated. Slopes are noisier than most practitioners realise. Weekly monitoring under tightly standardised conditions reached a reliability of .70, adequate for low-stakes instructional decisions, only after about 14 weeks, and did not reach .90, the level appropriate for eligibility decisions, even after 20 weeks. A systematic review of 102 documents on decision rules concluded that "most decision-making practices are based on expert opinion and that there is very limited psychometric or empirical support for such practices." The practice guide recommends monthly Tier 2 monitoring while conceding that "no studies have experimentally tested the impact of progress monitoring on outcomes in reading."
How schools decide a response was insufficient
Nothing in federal law defines the threshold. The regulation at 34 CFR §300.309(a)(2)(i) asks only whether the child "does not make sufficient progress to meet age or State-approved grade-level standards," and §300.309(b)(2) requires "data-based documentation of repeated assessments of achievement at reasonable intervals" that was given to the parents. Where a child has gone through an RTI process, §300.311(a)(7) requires the eligibility report to state the instructional strategies used, the student-centered data collected, and documentation that parents were told they could request an evaluation.
The operational definitions schools adopt are therefore local, and they disagree with each other. Barth and colleagues took a database of 399 first-graders and computed 808 comparisons among the cut points, measures and methods then in common use for classifying inadequate responders. Their finding: "agreement is generally poor and that different methods tend to identify different students as inadequate responders." A child can be a responder under one defensible rule and a non-responder under another.
Two legal guardrails matter. A district may spend up to 15 percent of its Part B funds on coordinated early intervening services under §300.226(a), which also bars reading that section "to delay appropriate evaluation of a child suspected of having a disability." Federal officials issued a memorandum in January 2011 stating that an RTI process cannot be used to delay or deny an eligibility evaluation, after learning that some districts were doing exactly that.
What the evidence shows
The largest test of RTI as implemented is that 2015 federal evaluation. Because each school set its own cut point, the researchers could compare students just below it against those just above. For first-graders near the cut point, assignment to Tier 2 or Tier 3 lowered spring scores on a comprehensive reading measure by 0.17 standard deviation (p = 0.002), which the report describes as roughly one-tenth of a year less learning. The other estimates were not statistically significant: −0.11 for first-grade sight-word efficiency, +0.10 for second grade, and −0.01 on third-grade state reading tests.
Three caveats belong with that result. The estimate applies to students near the threshold, not to severely struggling readers. It measures assignment rather than receipt of services. And implementation varied: school-level first-grade effects ranged from −1.18 to +0.53 standard deviation, 15 schools significantly negative and 4 significantly positive. Douglas and Lynn Fuchs argued in response that the evaluation asked too narrow a question and that the fidelity data "suggest many of them were not conducting RTI in a manner supported by research and policy," proposing simpler two-tier frameworks that more schools could execute properly.
The intervention content itself has decent support when it is actually delivered. A meta-analysis of 25 studies of intensive early reading intervention (100 or more sessions, grades K-3) found a weighted mean effect of g = 0.39, falling to 0.28 after adjustment for publication bias. A synthesis of 72 Tier 2 studies found effects of about 0.54 on standardised foundational reading measures and 0.36 on standardised language and comprehension measures.
The framework has also reshaped who gets identified. Students with a specific learning disability fell from 45.4 percent of all those served under IDEA in 2000-01 to 32.0 percent in 2022-23, and a study of statewide RTI adoption in Tennessee estimated a 61 percent average decrease in the odds of first-time identification by third grade. Its authors flagged the question their data could not answer: whether that reflects improved reading or merely later identification.
Our article on whether schools test for IQ covers where cognitive testing still enters the process. Readers who want a score with published norms and reported reliability can take an online IQ test built by psychometricians, the Reasoning and Intelligence Online Test, which reports confidence intervals rather than a bare number.
Frequently asked questions
What are the three tiers of RTI?
Tier 1 is the core instruction all students receive. Tier 2 adds targeted small-group instruction, commonly three to five sessions a week of 20 to 40 minutes. Tier 3 is more intensive still, usually daily and in smaller groups.
Can a school require RTI before evaluating my child for special education?
No. A 2011 federal memorandum states that an RTI process cannot be used to delay or deny an evaluation, and 34 CFR §300.309(c) requires the agency to promptly seek consent to evaluate whenever a child is referred or has not made adequate progress.
Does RTI replace IQ testing for learning disability eligibility?
Not entirely. A state must permit an RTI-based process, but it may also permit a pattern-of-strengths-and-weaknesses approach that uses cognitive testing, and the evaluation must still rule out intellectual disability.
How long should a Tier 2 intervention run before a decision?
Federal regulation says only "an appropriate period of time." The measurement research points toward at least 12 to 14 weeks of consistent weekly data before a growth slope is stable enough for even low-stakes decisions.
Does response to intervention work?
The instructional components have moderate evidence behind them, with Tier 2 small-group reading effects around 0.36 to 0.54 standard deviation. The framework as implemented in ordinary schools has a weaker record, including a significant negative effect for first-graders near the cut point in the 2015 federal evaluation.
The takeaway
Response to intervention replaced a bad idea, the IQ-achievement discrepancy, with a better one: change the instruction, measure the response, let the data drive the decision. That better idea depends on measurement harder than it looks. Screeners that catch nine in ten struggling readers also flag many children who would have been fine, growth slopes need months of data before they mean much, and no agreed definition of insufficient response exists. Ask what screener your school uses, how often progress is measured, and what rule defines insufficient response, and remember that you can request a full evaluation at any point.
References
1. Office of Special Education and Rehabilitative Services. (2011). A response to intervention (RTI) process cannot be used to delay-deny an evaluation for eligibility under the Individuals with Disabilities Education Act (IDEA) (OSEP Memorandum 11-07). U.S. Department of Education. sites.ed.gov
2. Assistance to States for the Education of Children With Disabilities, 34 C.F.R. §300.307 (2017). Specific learning disabilities.. sites.ed.gov
3. Assistance to States for the Education of Children With Disabilities, 34 C.F.R. §300.309 (2017). Determining the existence of a specific learning disability.. sites.ed.gov
4. Assistance to States for the Education of Children With Disabilities, 34 C.F.R. §300.311 (2017). Specific documentation for the eligibility determination.. sites.ed.gov
5. Assistance to States for the Education of Children With Disabilities, 34 C.F.R. §300.226. Early intervening services.. sites.ed.gov
6. Elementary and Secondary Education Act of 1965, Definitions, 20 U.S.C. §7801(33). law.cornell.edu
7. Balu, R., Zhu, P., Doolittle, F., Schiller, E., Jenkins, J., & Gersten, R. (2015). Evaluation of response to intervention practices for elementary school reading (NCEE 2016-4000). National Center for Education Evaluation and Regional Assistance, Institute of Education Sciences, U.S. Department of Education. ies.ed.gov
8. Weist, M. D., Garbacz, A., Schultz, B., Bradshaw, C. P., & Lane, K. L. (2024). Revisiting the percentage of K-12 students in need of preventive interventions in schools in a "peri-COVID" era: Implications for the implementation of tiered programming. Prevention Science, 25(3), 481-487. doi.org
9. Gersten, R., Compton, D., Connor, C. M., Dimino, J., Santoro, L., Linan-Thompson, S., & Tilly, W. D. (2009). Assisting students struggling with reading: Response to intervention and multi-tier intervention in the primary grades (NCEE 2009-4045). Institute of Education Sciences, U.S. Department of Education. ies.ed.gov
10. Catts, H. W., Petscher, Y., Schatschneider, C., Bridges, M. S., & Mendoza, K. (2009). Floor effects associated with universal screening and their impact on the early identification of reading disabilities. Journal of Learning Disabilities, 42(2), 163-176. repository.lib.fsu.edu
11. Van Norman, E. R., Christ, T. J., & Newell, K. W. (2017). Curriculum-based measurement of reading progress monitoring: The importance of growth magnitude and goal setting in decision making. School Psychology Review, 46(3), 320-328. files.eric.ed.gov
12. Ardoin, S. P., Christ, T. J., Morena, L. S., Cormier, D. C., & Klingbeil, D. A. (2013). A systematic review and summarization of the recommendations and research surrounding curriculum-based measurement of oral reading fluency decision rules. Journal of School Psychology, 51(1), 1-18. doi.org
13. Barth, A. E., Stuebing, K. K., Anthony, J. L., Denton, C. A., Mathes, P. G., Fletcher, J. M., & Francis, D. J. (2008). Agreement among response to intervention criteria for identifying responder status. Learning and Individual Differences, 18(3), 296-307. pmc.ncbi.nlm.nih.gov
14. Fuchs, D., & Fuchs, L. S. (2017). Critique of the national evaluation of response to intervention: A case for simpler frameworks. Exceptional Children, 83(3), 255-268. eric.ed.gov
15. Wanzek, J., Stevens, E. A., Williams, K. J., Scammacca, N., Vaughn, S., & Sargent, K. (2018). Current evidence on the effects of intensive early reading interventions. Journal of Learning Disabilities, 51(6), 612-624. files.eric.ed.gov
16. Gilmour, A. F., Harper, J., Lloyd, B., & Van Camp, A. (2024). Response to intervention and specific learning disability identification: Evidence from Tennessee. Journal of Learning Disabilities, 57(3), 168-180. eric.ed.gov
17. National Center for Education Statistics. (2024). Table 204.30: Children 3 to 21 years old served under Individuals with Disabilities Education Act (IDEA), Part B, by type of disability. Digest of Education Statistics. nces.ed.gov
Figure by Riot IQ. Observed data from Balu, Zhu, Doolittle, Schiller, Jenkins and Gersten (2015), Evaluation of Response to Intervention Practices for Elementary School Reading, NCEE 2016-4000, Figure 4.2. The 80/15/5 target is characterised per Weist, Garbacz, Schultz, Bradshaw and Lane (2024), Prevention Science, 25, 481-487.
Take our professional IQ test
Want to know your IQ? Try the first ever professional online IQ test.