Factor analysis: how the structure of an IQ test is discovered
Factor analysis is a statistical method that finds how many underlying abilities explain the correlations among test scores. Here is how IQ tests use it.
Dr. Russell T. WarneChief Scientist
Share
"Factor analysis" is a statistical method for working out how many underlying abilities are needed to account for the pattern of correlations among a set of test scores, and how strongly each test depends on each of those abilities. In cognitive assessment it is the tool that turns a stack of subtest scores into an index structure. It is the reason a Wechsler battery reports a Verbal Comprehension score and a Processing Speed score instead of sixteen unrelated numbers.
This page covers what the method does, how Charles Spearman and Louis Thurstone used it to produce two rival pictures of human ability, how to read its output, and the unsettled problem of deciding how many factors a battery contains.
What factor analysis actually does
The method exists because of one stubborn empirical fact. Scores on almost any two cognitive tests correlate positively, even when the tasks look nothing alike. Spearman found this in 1904 between school subjects and sensory discrimination, and it has turned up in essentially every cognitive battery since. The pattern is called the "positive manifold."
Factor analysis models each observed score as a weighted combination of a small number of unobserved variables plus a remainder specific to that test. In words: a subtest score equals the sum, across factors, of each factor score multiplied by its weight for that subtest, plus whatever is unique to the subtest and its measurement error. The weights are "factor loadings," and a loading reads as the correlation between the subtest and the factor when the factors are uncorrelated. The share of a subtest's variance that the factors jointly explain is its "communality," and the leftover is uniqueness.
That framing has a practical payoff. If four vocabulary-flavoured subtests load highly on one factor and barely at all on the others, a publisher has a defensible case for summing them into one index score. If a subtest loads on nothing, the case for reporting it as part of anything collapses.
The method also punctures easy claims. Raven's Progressive Matrices is often called a pure measure of general ability, and Gignac (2015) tested that across several large samples: Raven's shared roughly half its variance with the general factor, about a tenth with a fluid-reasoning factor orthogonal to it, and carried around a quarter reliable variance specific to the test itself.
Spearman, Thurstone, and where the method came from
Spearman invented factor analysis to answer a question about intelligence, which is why this history is not decoration. Working with correlations among school marks, sensory discrimination and teachers' ratings of cleverness, he concluded in the American Journal of Psychology in 1904 that "whenever branches of intellectual activity are at all dissimilar, then their correlations with one another appear wholly due to their being all variously saturated with some common fundamental Function (or group of Functions)." He called the shared part general intelligence and the rest specific, and he described the result as needing "a much vaster corroborative basis" before anyone accepted it as a general principle. Our page on the g factor covers what that general factor predicts.
Thurstone attacked the same structure with more factors and a new idea. In his 1938 monograph Primary Mental Abilities he gave 56 tests to 240 volunteers, extracted twelve common factors, then rotated the axes to what he called "simple structure," an orientation in which each test loads on as few factors as possible. Rotation is the part most readers miss. A factor solution is not unique, because the axes can be turned freely without changing how well the model fits, so the labels attached to factors rest on a choice the analyst makes. Thurstone's rotated solution gave him separate spatial, number, memory, verbal, word-fluency, perceptual and reasoning factors, seven of which he treated as "landmarks" for later work. He was candid about the disagreement: "So far in our work we have not found the general factor of Spearman, but our methods do not preclude it."
The reconciliation arrived decades later through the same method. Carroll (1993) reanalysed the accumulated factor-analytic literature and arranged the results as three strata, with narrow abilities at the bottom, roughly eight broad abilities above them, and a general factor at the top. His endorsement of Cattell and Horn's Gf-Gc work produced the Cattell-Horn-Carroll taxonomy that now organises most commercial batteries, as McGrew (2023) documents. Our explainer on fluid and crystallized intelligence covers the two broad abilities readers meet most often.
Reading the output: eigenvalues, loadings, communalities
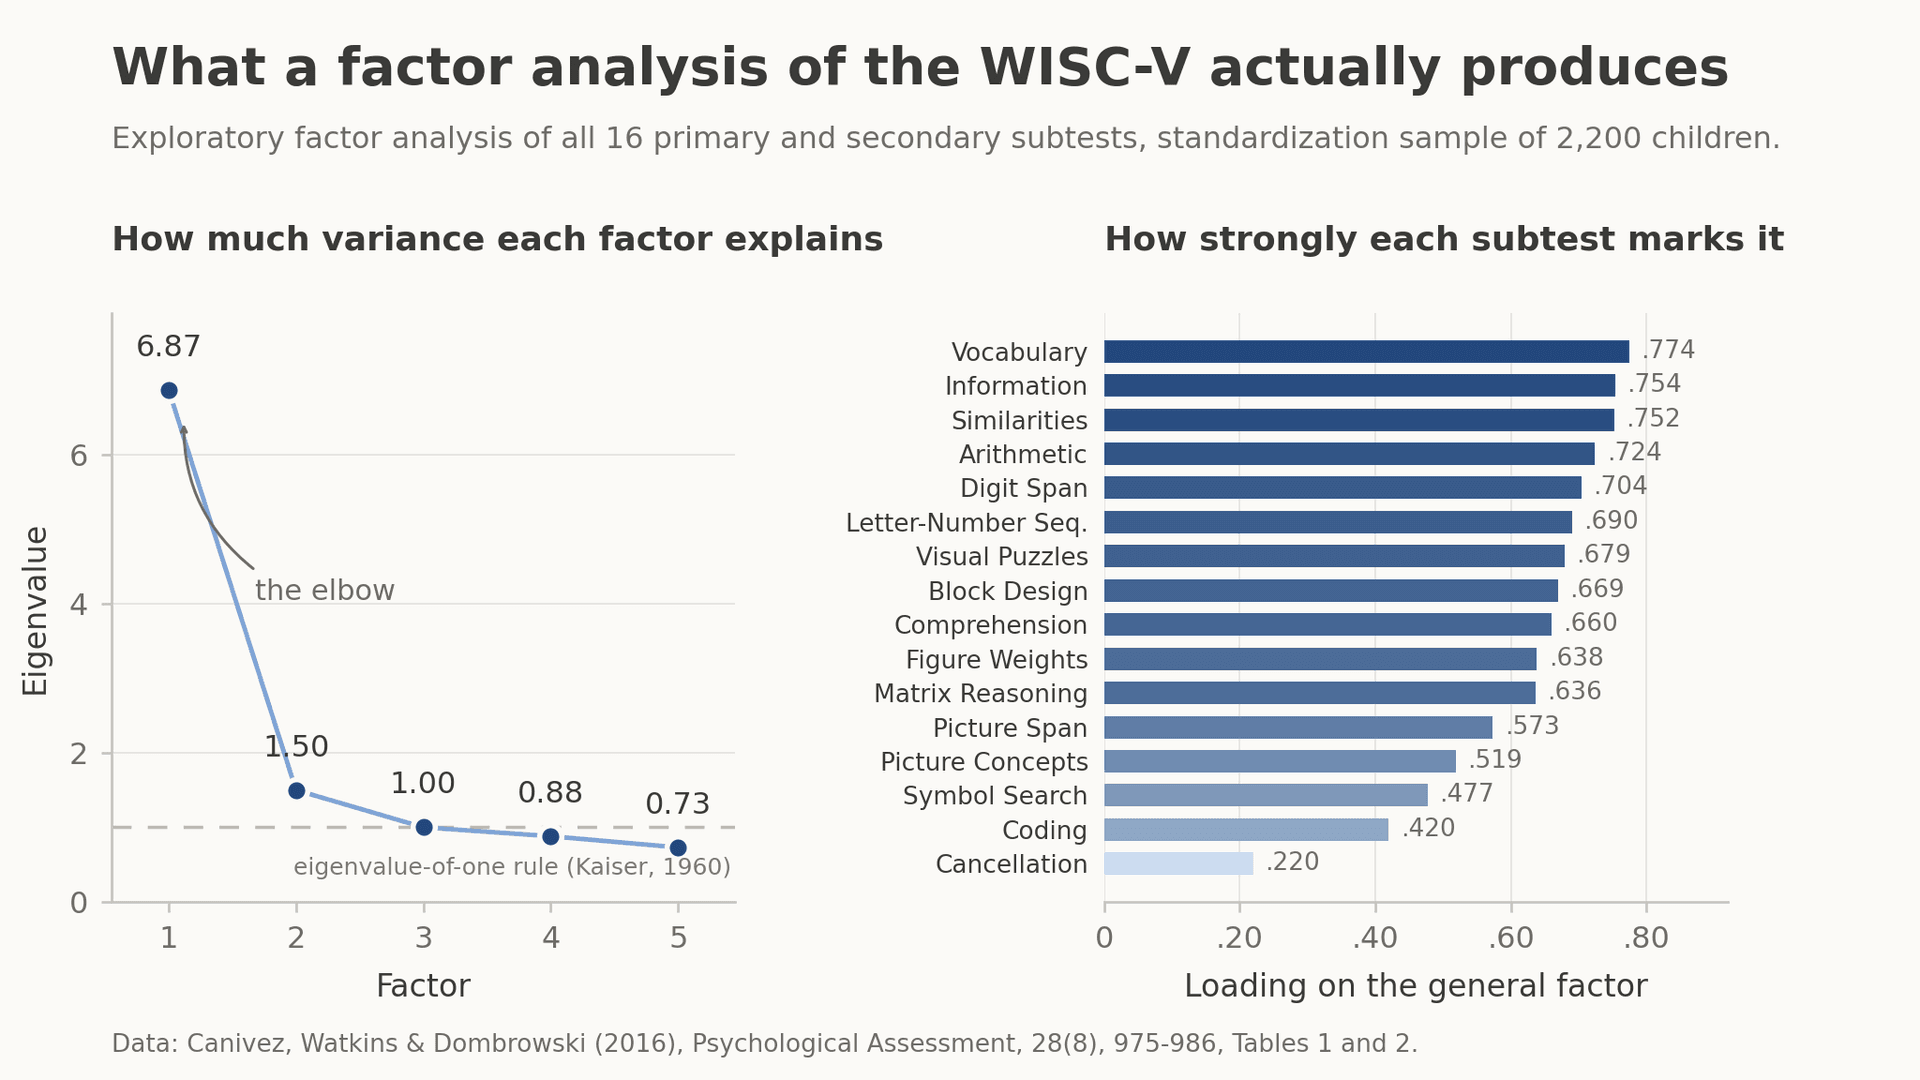
Canivez, Watkins and Dombrowski (2016) ran an exploratory factor analysis of the 16 primary and secondary subtests of the WISC-V standardization sample of 2,200 children and published the intermediate output that test manuals usually omit.
• Eigenvalues: An "eigenvalue" is the amount of variance a factor accounts for, measured in units of one subtest's worth of variance. The first five reported for the WISC-V were 6.87, 1.50, 1.00, 0.88 and 0.73, the first factor accounting for about 40 percent of the battery's variance and the second for about 6 percent. That steep drop is the positive manifold showing up in arithmetic.
• Loadings on the general factor: In the four-factor solution these ran from .774 for Vocabulary down to .220 for Cancellation, with Information at .754 and Coding at .420. Verbal tasks are strong indicators of general ability and clerical speed tasks are weak ones, a finding about the tasks rather than about the children.
• Communalities: Vocabulary's communality was .735, so the extracted factors explained about three-quarters of its variance. Cancellation's was .182. A subtest with a low communality contributes little to any composite it sits in.
• Factor correlations: The four factors correlated between .387 and .747. Correlated factors are themselves evidence that something general sits above them, which is how hierarchical models of ability are built.
The number-of-factors problem
Deciding how many factors to keep changes what a test appears to measure more than any other step, and no settled rule governs it. Several criteria are in routine use.
• The eigenvalue-of-one rule: Kaiser (1960) proposed keeping factors with eigenvalues above 1.0, on the reasoning that a factor accounting for less than one test's worth of variance is not earning its place. It is the default in much software and it is unreliable. Zwick and Velicer (1986) compared five retention rules under controlled conditions and found this one badly overestimated the number of components.
• The scree test: Cattell (1966) suggested plotting eigenvalues in descending order and keeping the factors above the point where the curve flattens into rubble, the "scree." Applied to the WISC-V figures above, the elbow arrives immediately after the first eigenvalue. The judgement is visual, which is its weakness.
• Parallel analysis: Horn (1965) proposed comparing each observed eigenvalue against the eigenvalue obtained from random data of the same size and shape, keeping only factors that beat chance. Zwick and Velicer found this and the minimum-average-partial method the most accurate rules they tested.
• Judgement about interpretability: A factor defined by one salient subtest usually signals overextraction rather than a discovery. That is what Canivez and colleagues reported when they forced five factors out of the WISC-V: the fifth picked up a single salient loading, and two subtests loaded saliently on nothing.
Exploratory analysis of this kind asks the data how many factors there are. The alternative is to specify a structure in advance and test how well it reproduces the observed correlations, which is confirmatory factor analysis. That approach carries its own machinery of fit indices, and it is what test publishers use when they defend a published index structure. Our companion article on confirmatory factor analysis covers it.
What factor analysis cannot settle
A factor is a mathematical summary of shared variance, and calling one "Fluid Reasoning" is an interpretation laid on top of arithmetic. Because rotation leaves fit unchanged, two analysts can describe the same battery with different numbers of differently named factors and both can be defensible. The AERA, APA and NCME Standards for Educational and Psychological Testing handle this carefully. Standard 1.13 requires that where a score interpretation depends on premises about the relationships among parts of a test, "evidence concerning the internal structure of the test should be provided," and notes that such a claim "could be supported by a multivariate statistical analysis, such as a factor analysis."
Two limits are worth holding onto. A factor solution describes covariation in one sample on one set of tasks, so a battery with no working-memory tests will never produce a working-memory factor. And covariance structure says nothing directly about causes, since a general factor is consistent with several different accounts of why abilities hang together.
None of that makes the method optional. Everything downstream depends on it, from which subtests a publisher keeps to which composites a psychologist may interpret. Our guide to creating an IQ test walks through the rest of the build process, and readers who would rather see the output can take a full-length online IQ test, the Reasoning and Intelligence Online Test, which reports index scores derived from this kind of analysis.
Frequently asked questions
Is factor analysis the same as principal component analysis?
No. Principal component analysis re-expresses the observed variables as weighted sums of themselves and explains all of their variance, including the unique part. Common factor analysis models only the shared variance. They often give similar answers, and they answer different questions.
What is a good factor loading?
Convention rather than law. Thurstone (1938) declined to name a factor unless loadings reached about .40, and preferred .50 or .60 before he felt confident, because a loading of .40 means the factor accounts for only 16 percent of a test's variance. Modern reports commonly treat .30 as the threshold for calling a loading salient.
Does factor analysis prove that g exists?
It shows that cognitive test scores share a large common component. Whether that component is one causal process or the summed effect of many is not a question a correlation matrix can answer, and researchers who accept the statistical finding still disagree about its interpretation.
Why do different studies find different numbers of factors for the same test?
Because the answer depends on the retention rule used, which subtests are in the battery, whether factors are allowed to correlate, and how the axes are rotated. The WISC-V is the clearest current case: its publisher reports five factors, and independent analyses of the same standardization sample have supported four.
References
1. Spearman, C. (1904). "General intelligence," objectively determined and measured. The American Journal of Psychology, 15(2), 201-292. jstor.org
2. Thurstone, L. L. (1938). Primary mental abilities (Psychometric Monographs No. 1). University of Chicago Press. archive.org
3. McGrew, K. S. (2023). Carroll's three-stratum (3S) cognitive ability theory at 30 years. Journal of Intelligence, 11(2), 32. pmc.ncbi.nlm.nih.gov
4. Kaiser, H. F. (1960). The application of electronic computers to factor analysis. Educational and Psychological Measurement, 20(1), 141-151. doi.org
5. Cattell, R. B. (1966). The scree test for the number of factors. Multivariate Behavioral Research, 1(2), 245-276. pubmed.ncbi.nlm.nih.gov
6. Horn, J. L. (1965). A rationale and test for the number of factors in factor analysis. Psychometrika, 30(2), 179-185. doi.org
7. Zwick, W. R., & Velicer, W. F. (1986). Comparison of five rules for determining the number of components to retain. Psychological Bulletin, 99(3), 432-442. doi.org
8. Canivez, G. L., Watkins, M. W., & Dombrowski, S. C. (2016). Factor structure of the Wechsler Intelligence Scale for Children-Fifth Edition: Exploratory factor analyses with the 16 primary and secondary subtests. Psychological Assessment, 28(8), 975-986. doi.org
9. Gignac, G. E. (2015). Raven's is not a pure measure of general intelligence. Intelligence, 52, 71-79. doi.org
10. American Educational Research Association, American Psychological Association, & National Council on Measurement in Education. (2014). Standards for educational and psychological testing. AERA. testingstandards.net
Figure by Riot IQ. Data from Canivez, Watkins and Dombrowski (2016), Psychological Assessment, 28(8), 975-986, Tables 1 and 2.
Take our professional IQ test
Want to know your IQ? Try the first ever professional online IQ test.