Fluoride and IQ: What the Evidence Shows at Different Exposure Levels
Fluoride IQ research links high exposure, above 1.5 mg/L in water, to lower children's IQ. At the 0.7 mg/L used in US fluoridation, the evidence is unclear.
Dr. Russell T. WarneChief Scientist
Share
Higher fluoride exposure is associated with lower IQ in children: a 2025 meta-analysis found IQ scores about 1.6 points lower for every 1 mg/L more fluoride in children's urine, and a US government review rated the link "moderate confidence" for drinking water above 1.5 mg/L. At the 0.7 mg/L recommended for community water fluoridation in the United States, the evidence is thin and conflicting, so any effect at that level is unproven and, if it exists, probably small.
Most of the fluoride IQ debate comes down to dose. This page covers what the National Toxicology Program concluded in 2024, how large the effect is in the newest meta-analysis, what studies at fluoridation levels found, and why these studies are harder to interpret than the headlines suggest.
What the National Toxicology Program concluded
The central US assessment is the 2024 monograph from the National Toxicology Program (NTP), part of the US Department of Health and Human Services. Its systematic review identified 72 studies of fluoride and children's IQ. It rated 19 of them as high quality, and 18 of those 19 reported an inverse association, meaning more fluoride went with lower scores. An updated literature search through October 2023 did not change the conclusion.
The exact wording of the conclusion matters. The NTP found, "with moderate confidence," that higher estimated fluoride exposures, "e.g., as in approximations of exposure such as drinking water fluoride concentrations that exceed" the World Health Organization guideline of 1.5 mg/L, "are consistently associated with lower IQ in children." It rated the evidence on adults as low confidence and said more research is needed on lower exposures.
The monograph is equally clear about its limits. It states that it does not address whether fluoride added to drinking water at 0.7 mg/L, the level used in the United States and Canada, has a measurable effect on IQ, and it does not estimate how many IQ points are lost per unit of exposure. None of the IQ studies it reviewed were conducted in the United States.
How big is the effect? The 2025 meta-analysis
The quantitative estimate came from a companion meta-analysis led by Kyla Taylor of the National Institute of Environmental Health Sciences, published in JAMA Pediatrics in 2025. It included 74 studies, 64 cross-sectional and 10 cohort studies, with 45 from China and 12 from India. The authors rated 52 of the 74 studies as high risk of bias.
Comparing the highest-exposure and lowest-exposure groups in 59 studies, the pooled "standardized mean difference" (the gap between groups expressed in standard deviations) was -0.45. On a scale where one standard deviation is 15 points, that converts to about 7 IQ points. Among the 12 low risk-of-bias studies the gap was -0.19, or roughly 3 points.
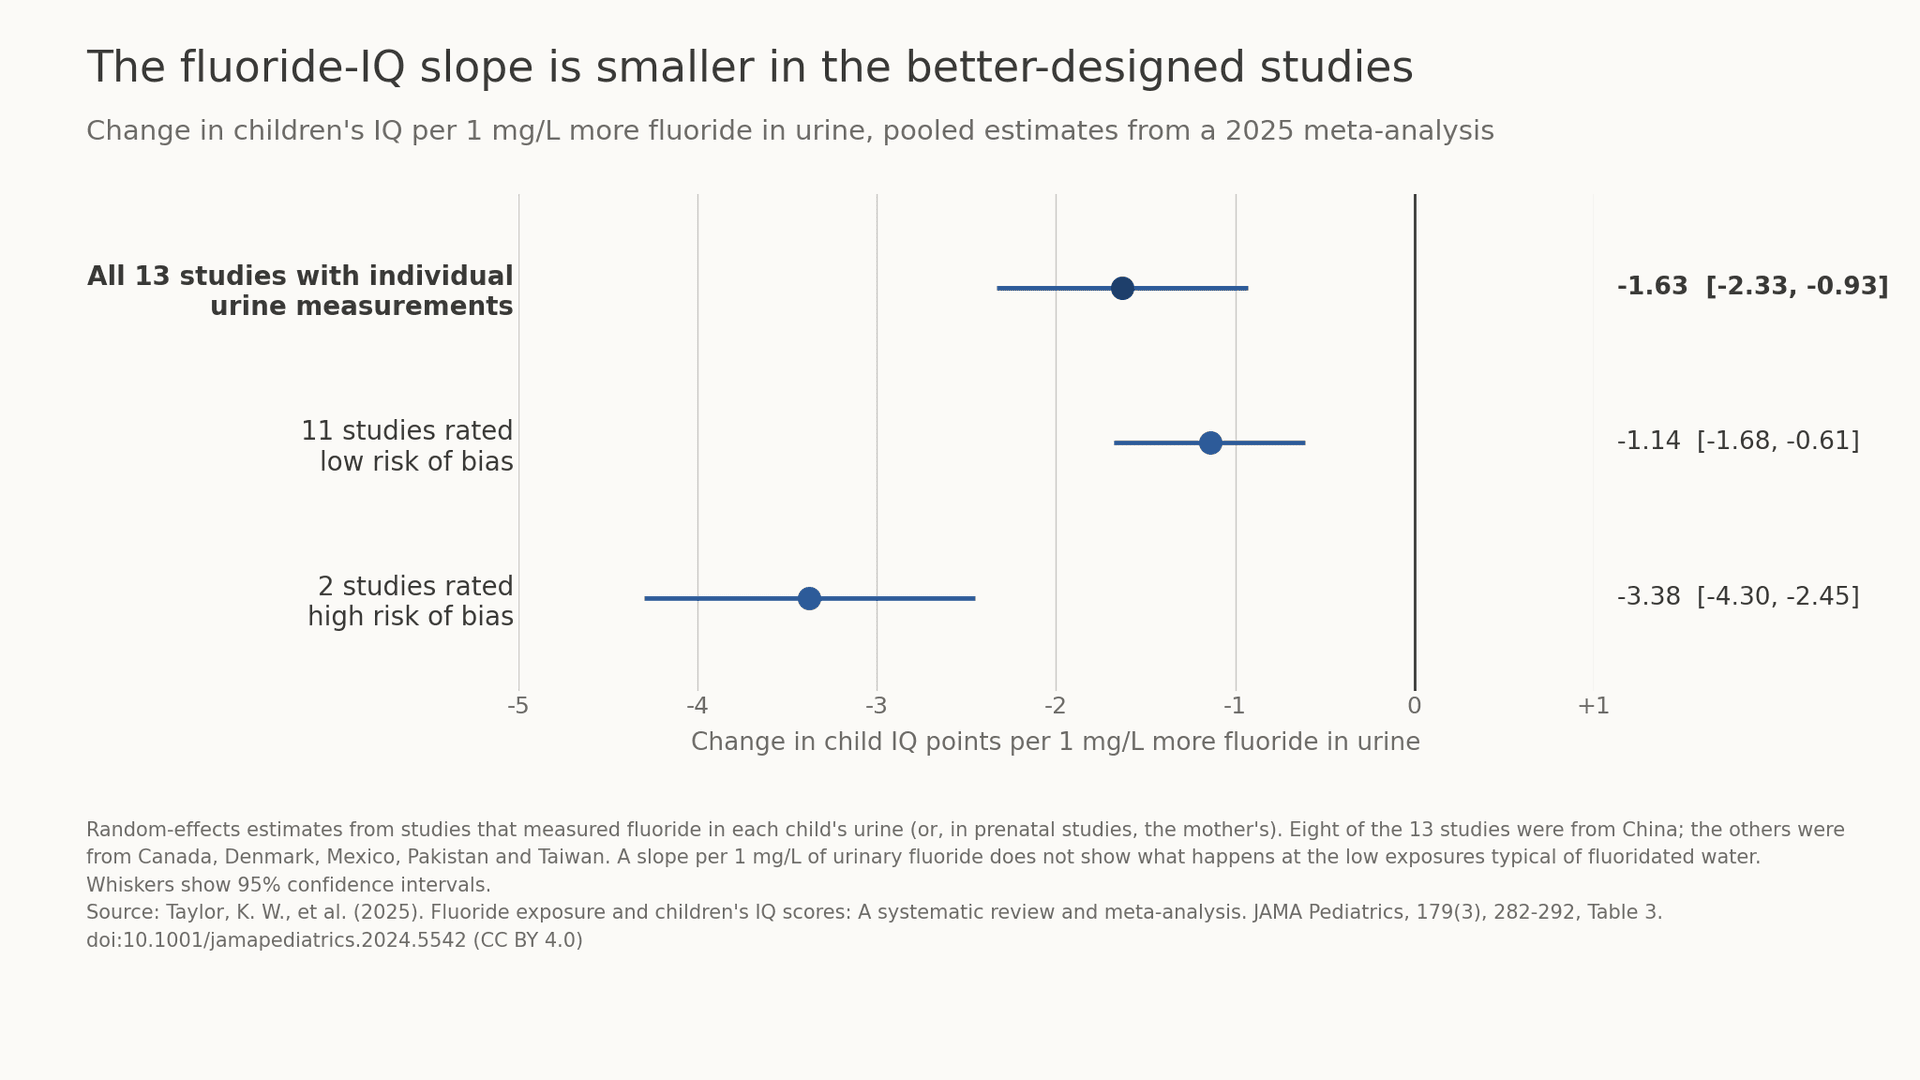
The more useful number is the dose-response slope. In 13 studies that measured fluoride in each child's urine, or the mother's urine during pregnancy, IQ was 1.63 points lower for every 1 mg/L increase (95% confidence interval -2.33 to -0.93). In the 11 studies rated low risk of bias, the slope was 1.14 points (-1.68 to -0.61). The chart above shows both estimates, along with the much steeper slope from the two high-bias studies.
The threshold debate turns on one table. When the analysis of drinking water studies was restricted to exposed groups below 1.5 mg/L, the association disappeared: seven studies with 2,832 children produced a slope near zero (0.05, with an interval of -0.36 to 0.45). Among the three low risk-of-bias studies in that range, the estimate was negative but its interval also crossed zero. The authors wrote that the data at these concentrations were "limited" and uncertain, and that their meta-analysis was not designed to address water fluoridation in the United States.
Studies at the levels used in water fluoridation
The most debated study at fluoridation levels is a 2019 Canadian cohort led by Rivka Green and Christine Till. It measured fluoride in the urine of 512 pregnant women and tested their children at ages 3 to 4. Each 1 mg/L increase in the mother's urinary fluoride was linked to a 4.49-point lower IQ in boys (-8.38 to -0.60), with no significant association in girls. Women in fluoridated cities averaged 0.69 mg/L in their urine, compared with 0.40 mg/L in non-fluoridated cities.
The paper was heavily contested. JAMA Pediatrics ran an editor's note explaining its decision to publish it, and a later issue carried ten letters responding to it.
As a rough illustration, if the low risk-of-bias slope of 1.14 points per mg/L held at these low levels, the 0.29 mg/L difference between fluoridated and non-fluoridated mothers in that study would correspond to about a third of an IQ point (0.29 × 1.14). That is a big if, since the meta-analysis itself found little data below 1.5 mg/L.
Other studies at fluoridation levels found no effect:
• New Zealand: The Dunedin cohort, born in 1972 and 1973 and followed to age 38, compared people who grew up with and without fluoridated water, fluoride toothpaste and fluoride tablets. Jonathan Broadbent and colleagues found no clear IQ differences in childhood or adulthood after adjusting for sex, socioeconomic status, breastfeeding and birth weight.
• Sweden: Economists Linuz Aggeborn and Mattias Öhman used Swedish registry data and natural variation in fluoride at water sources, a design closer to a natural experiment. They estimated "a zero effect on cognitive ability," confirmed fluoride's benefit to teeth, and found higher later earnings.
• A meta-analysis of low-exposure areas: A 2023 review by Jayanth Kumar and colleagues pooled eight studies from areas without endemic fluorosis and found no significant difference between recommended and lower fluoride levels (standardized mean difference 0.07, interval -0.02 to 0.17).
Kumar's team drew partly on the NTP's own database of studies, yet reached a different conclusion about low exposures than Taylor's group, which is a fair summary of where the field stands.
Why fluoride studies are hard to interpret
Most of the evidence comes from cross-sectional comparisons of communities with naturally high fluoride against communities with less, often in poor rural areas. Those places can differ in many ways, including poverty, nutrition, schooling and other contaminants in the water. Broadbent's team argued that earlier links between very high fluoride and low IQ may have been confounded, "particularly by urban or rural status." The same family-background problem runs through other early-life questions, such as breastfeeding and IQ.
Measurement adds noise. Many Chinese studies used a rural edition of a Raven-style reasoning test, and urinary fluoride reflects intake from food, tea and dental products as well as water. Studies that measured exposure in individual children or mothers tend to be better designed: 11 of the 13 in the dose-response analysis were rated low risk of bias.
The size of the population at the higher levels is also small in the United States. According to the NTP, about 0.59% of Americans, roughly 1.9 million people, were served in 2020 by community water systems with naturally occurring fluoride at or above 1.5 mg/L. Other environmental toxins are covered in our overview of environmental influences on cognitive abilities.
Regulation is split. The US Public Health Service recommends 0.7 mg/L for water systems that add fluoride. The Environmental Protection Agency sets an enforceable maximum of 4.0 mg/L and a non-enforceable secondary standard of 2.0 mg/L, and the decision to fluoridate is made by state and local governments. Questions about a household's water supply can go to the local water utility or health department, and questions about a child's fluoride intake to a pediatrician or dentist.
Frequently asked questions
Does fluoride lower IQ?
At high exposures, above about 1.5 mg/L in drinking water, the evidence consistently links fluoride to lower children's IQ. At the 0.7 mg/L used in US fluoridation, studies conflict and no effect has been established.
How many IQ points are linked to fluoride?
The 2025 meta-analysis found about 1.6 IQ points lower per 1 mg/L more fluoride in urine, or 1.1 points in the better-designed studies. Typical differences in urinary fluoride between fluoridated and non-fluoridated areas are well under 1 mg/L.
What did the NTP report conclude about fluoride?
It concluded with moderate confidence that fluoride exposures above roughly 1.5 mg/L in drinking water are associated with lower IQ in children. It explicitly did not assess fluoridation at 0.7 mg/L.
Is fluoride exposure during pregnancy linked to IQ?
A 2019 Canadian study linked higher maternal urinary fluoride to lower IQ in boys but not girls. The finding was heavily debated, and prenatal studies in the 2025 meta-analysis had a pooled estimate whose confidence interval included zero.
Does fluoride affect adult IQ?
There is little evidence either way. The NTP rated the adult evidence as low confidence because only two high-quality studies were available.
The takeaway
The fluoride IQ question has two answers depending on dose. At naturally high exposures found in parts of China, India and elsewhere, the association with lower children's IQ is consistent, and the best estimate is a loss of about 1 to 2 points per 1 mg/L of urinary fluoride. At the levels used in North American water fluoridation, the data are limited, the strongest studies disagree, and any effect would likely be a fraction of a point, well inside the measurement error of a single test. That puts fluoride in a different evidence class from lead exposure, whose link to lower IQ rests on children's blood measurements pooled across several countries. If you want a reliable measure of your own reasoning abilities, you can try a professionally developed IQ test with modern norms.
References
1. National Toxicology Program. (2024). NTP monograph on the state of the science concerning fluoride exposure and neurodevelopment and cognition: A systematic review (NTP Monograph 08). U.S. Department of Health and Human Services. [doi.org/10.22427/NTP-MGRAPH-8](. doi.org
2. Taylor, K. W., Eftim, S. E., Sibrizzi, C. A., Blain, R. B., Magnuson, K., Hartman, P. A., Rooney, A. A., & Bucher, J. R. (2025). Fluoride exposure and children's IQ scores: A systematic review and meta-analysis. JAMA Pediatrics, 179(3), 282-292. [doi.org/10.1001/jamapediatrics.2024.5542](. doi.org
3. Green, R., Lanphear, B., Hornung, R., Flora, D., Martinez-Mier, E. A., Neufeld, R., Ayotte, P., Muckle, G., & Till, C. (2019). Association between maternal fluoride exposure during pregnancy and IQ scores in offspring in Canada. JAMA Pediatrics, 173(10), 940-948. [doi.org/10.1001/jamapediatrics.2019.1729](. doi.org
4. Christakis, D. A. (2019). Decision to publish study on maternal fluoride exposure during pregnancy. JAMA Pediatrics, 173(10), 948. [doi.org/10.1001/jamapediatrics.2019.3120](. doi.org
5. Broadbent, J. M., Thomson, W. M., Ramrakha, S., Moffitt, T. E., Zeng, J., Foster Page, L. A., & Poulton, R. (2015). Community water fluoridation and intelligence: Prospective study in New Zealand. American Journal of Public Health, 105(1), 72-76. [doi.org/10.2105/AJPH.2013.301857](. doi.org
6. Aggeborn, L., & Öhman, M. (2021). The effects of fluoride in drinking water. Journal of Political Economy, 129(2), 465-491. [doi.org/10.1086/711915](. doi.org
7. Kumar, J. V., Moss, M. E., Liu, H., & Fisher-Owens, S. (2023). Association between low fluoride exposure and children's intelligence: A meta-analysis relevant to community water fluoridation. Public Health, 219, 73-84. [doi.org/10.1016/j.puhe.2023.03.011](. doi.org
8. U.S. Department of Health and Human Services Federal Panel on Community Water Fluoridation. (2015). U.S. Public Health Service recommendation for fluoride concentration in drinking water for the prevention of dental caries. Public Health Reports, 130(4), 318-331. [doi.org/10.1177/003335491513000408](. doi.org
Figure by RIOT IQ. Data from Taylor et al. (2025), JAMA Pediatrics 179(3), 282-292, Table 3 (doi.org/10.1001/jamapediatrics.2024.5542), CC BY 4.0.
Take our professional IQ test
Want to know your IQ? Try the first ever professional online IQ test.