Scaled score to percentile: converting Wechsler subtest scores
Scaled score to percentile: on the Wechsler subtest scale (mean 10, SD 3) a 10 is the 50th percentile, 13 the 84th and 16 the 98th. Full 1 to 19 table.
Dr. Russell T. WarneChief Scientist
Share
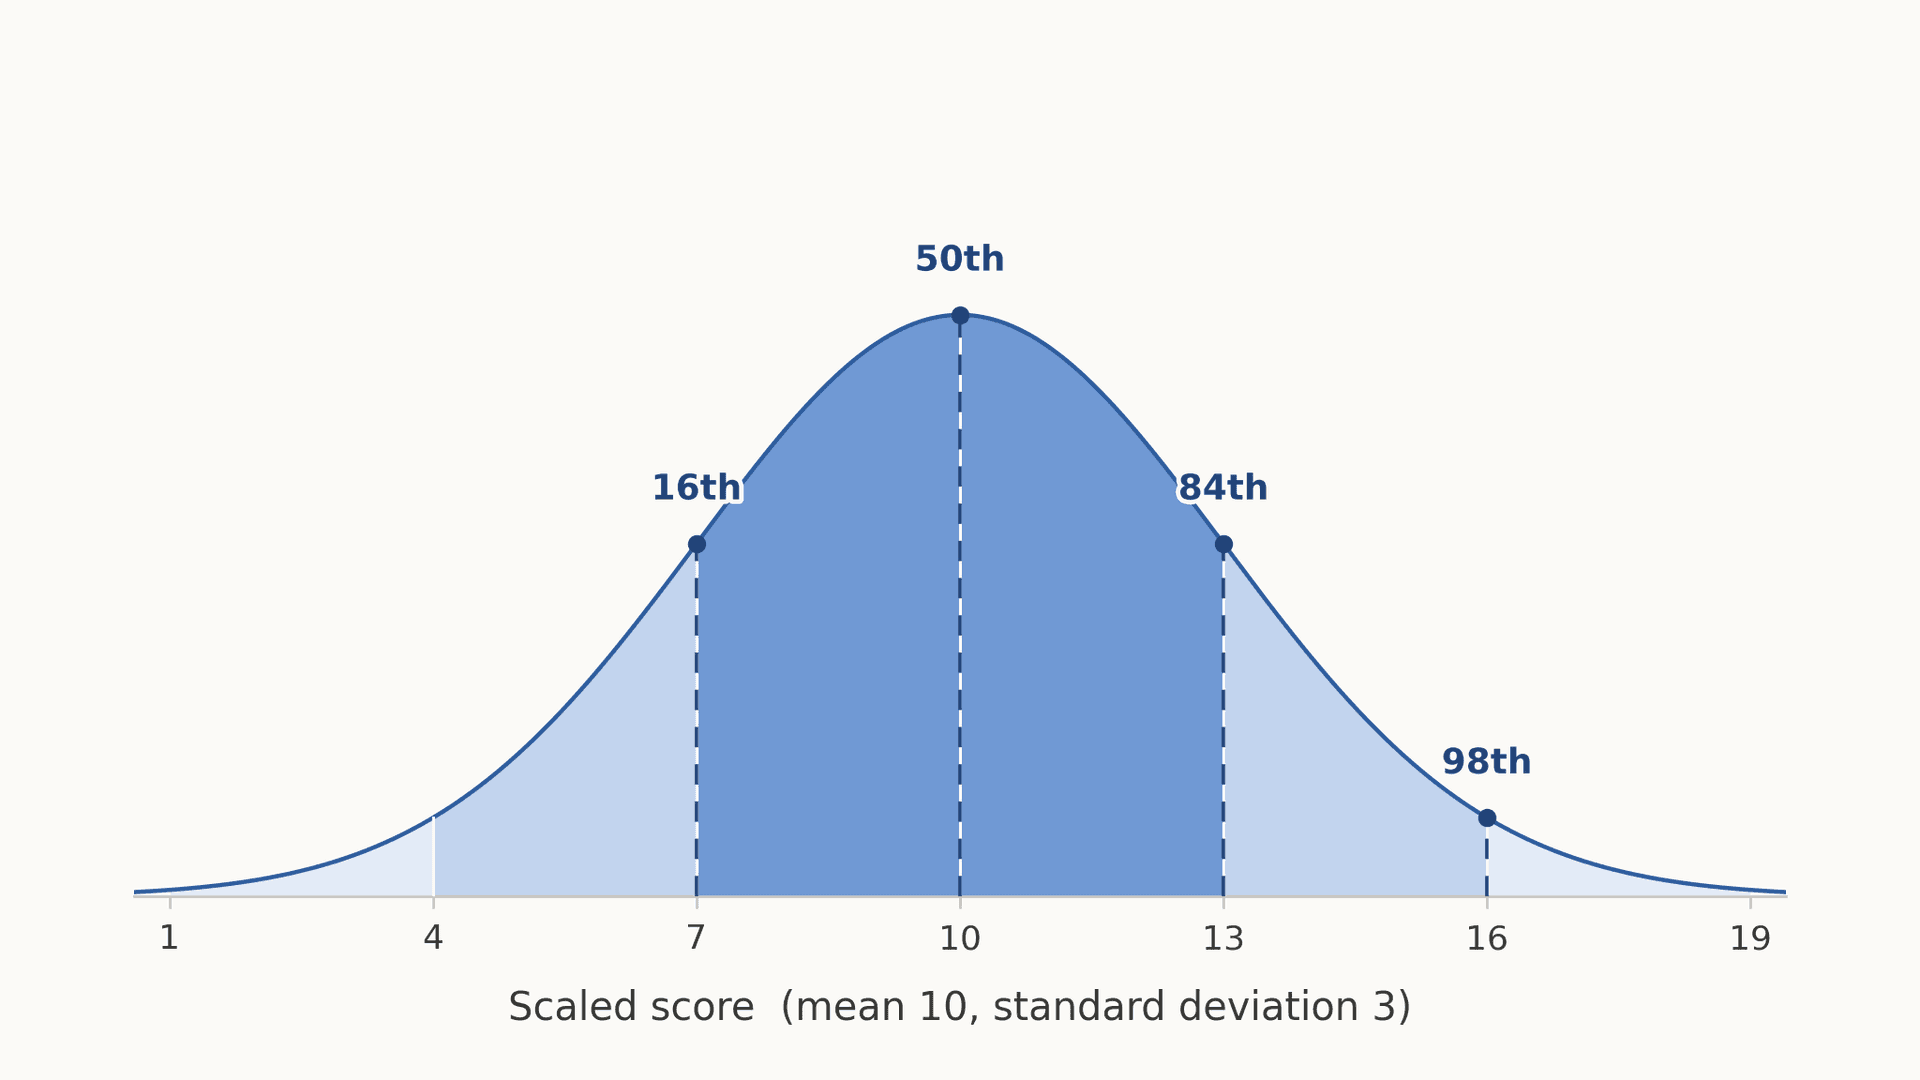
A Wechsler subtest scaled score converts to a percentile through the normal curve, where the mean is 10 and the standard deviation is 3: a scaled score of 10 is the 50th percentile, 13 is the 84th, 16 is the 98th, and 7 is the 16th. This page covers that one metric, the "scaled score" that Wechsler subtests are reported on. It is not about index and IQ scores, which use a mean of 100 and a standard deviation of 15 and are covered in our guide to converting a standard score to a percentile, nor about T scores, which use a mean of 50 and a standard deviation of 10 and are covered in converting a T score to a percentile. Mixing the three up is the commonest error people make reading a score report.
Why subtests use a different scale from composites
A "scaled score" is a subtest score converted onto a common metric so it can be compared with other subtests and with same-age peers. Pearson, publisher of the Wechsler scales, states the metric plainly in its WISC-V interpretive report: the primary and secondary subtests "are on a scaled score metric with a mean of 10 and a standard deviation (SD) of 3," and those scores "range from 1 to 19, with scores between 8 and 12 typically considered average." The WPPSI-IV report says the same for preschoolers, and the WAIS-5, published in 2024 for ages 16:0 to 90:11, follows the same convention.
Composites work differently. In the same report, the five primary index scores and the Full Scale IQ sit "on a standard score metric with a mean of 100 and an SD of 15," with index scores ranging from 45 to 155 and the Full Scale IQ from 40 to 160.
Both scales carry the same information, since both are the normal curve with different labels. The reason for the smaller one is practical. A subtest is a short task, and a short task cannot support fine distinctions; spreading a dozen items across a 40 to 160 range would invite readers to treat a one-point wobble as meaningful when it is noise. Composites earn the wider scale because they pool several subtests.
For the step before this one, how a count of correct answers becomes a scaled score at all, see our explainer on raw score versus scaled score.
Scaled score to percentile: the full 1 to 19 conversion
Each value below is the area under the normal curve to the left of that scaled score, computed from a mean of 10 and an SD of 3, followed by the equivalent value on the mean-100 scale.
• Scaled score 1: about the 0.1st percentile, equivalent to 55 on the mean-100 scale.
• Scaled score 2: about the 0.4th percentile, equivalent to 60.
• Scaled score 3: about the 1st percentile, equivalent to 65.
• Scaled score 4: about the 2nd percentile, equivalent to 70.
• Scaled score 5: about the 5th percentile, equivalent to 75.
• Scaled score 6: about the 9th percentile, equivalent to 80.
• Scaled score 7: about the 16th percentile, equivalent to 85. One standard deviation below the mean.
• Scaled score 8: about the 25th percentile, equivalent to 90. The bottom of Pearson's typical average band.
• Scaled score 9: about the 37th percentile, equivalent to 95.
• Scaled score 10: the 50th percentile, equivalent to 100. The exact centre of the distribution.
• Scaled score 11: about the 63rd percentile, equivalent to 105.
• Scaled score 12: about the 75th percentile, equivalent to 110. The top of that average band.
• Scaled score 13: about the 84th percentile, equivalent to 115. One standard deviation above the mean.
• Scaled score 14: about the 91st percentile, equivalent to 120.
• Scaled score 15: about the 95th percentile, equivalent to 125.
• Scaled score 16: about the 98th percentile, equivalent to 130. Two standard deviations above the mean.
• Scaled score 17: about the 99th percentile, equivalent to 135.
• Scaled score 18: about the 99.6th percentile, equivalent to 140.
• Scaled score 19: about the 99.9th percentile, equivalent to 145. Three standard deviations above the mean, and the ceiling of the scale.
Pearson's sample WISC-V report prints subtest percentile ranks alongside the scaled scores, and they line up: 8 at the 25th, 9 at the 37th, 12 at the 75th, 13 at the 84th, 15 at the 95th, 16 at the 98th, 17 at the 99th and 19 at the 99.9th.
Notice how uneven the steps are. Moving from 10 to 11 gains about thirteen percentile points; moving from 18 to 19 gains about a quarter of one point. Percentiles are not an equal-interval scale, so a given gap near the middle reflects a far smaller ability difference than the same gap out in the tails, a property our guide to IQ percentiles works through.
Three scaled points equal fifteen points of IQ
One standard deviation is 3 points on the subtest scale and 15 points on the index scale, so a one-point move on a subtest is worth five points of IQ. The conversion is: index equivalent = 100 + 5 × (scaled score − 10).
That gearing is why "scaled 13" and "IQ 13" describe opposite ends of the world. A scaled score of 13 is a clearly above-average performance, around the 84th percentile, while an IQ of 13 is not a score at all, since the Full Scale IQ bottoms out at 40. It is a common source of alarm among parents reading a subtest column of 9s, 11s and 13s as though those were IQ figures. If the numbers fall between 1 and 19, you are reading subtests; between 40 and 160, composites.
The gearing cuts both ways: a three-point gap between two subtests looks small but corresponds to a full standard deviation, fifteen points on the familiar IQ metric.
Percentile rank is not percentage correct
A percentile rank answers a question about ranking, not accuracy. Pearson defines it in the WISC-V report as the child's "standing relative to other same-age children in the WISC-V normative sample," with the worked example that a percentile rank of 92 means the child "performed as well as or better than approximately 92% of children her age."
So a scaled score of 16 at the 98th percentile does not mean 98 percent of items were answered correctly; it means the performance outranked roughly 98 percent of the comparison group. That group matters as much as the number, because the norms are age-banded: the same raw performance yields a different scaled score at age 7 than at age 15.
Why a single subtest score should not be read alone
Subtest scaled scores are the least reliable numbers on a score report, and the profile of highs and lows across them is less informative than it looks.
• Precision is lower at the subtest level: in Pearson's sample WISC-V report, standard errors of measurement for individual subtests ran from 0.73 to 1.37 scaled points, roughly 3.7 to 6.9 points on the mean-100 scale, against a Full Scale IQ standard error of 3.00.
• Pearson's reliability figures show the effect: WISC-V Technical Report #1 gives overall coefficients of .96 for the Full Scale IQ and .95 for the Nonverbal Index, against .92 for the two-subtest Verbal Comprehension Index and .93 for the two-subtest Fluid Reasoning Index, attributing the difference to how many subtests feed each composite.
• Uneven profiles are ordinary: in the WISC-III normative sample of 2,200 children, the average spread between a child's highest and lowest of ten subtest scaled scores was 7.5 points (SD 2.3). A jagged profile is the norm, not a finding.
• Scatter has poor diagnostic accuracy: Marley Watkins tested four ways of quantifying subtest scatter against that normative sample and 1,592 students with learning disabilities. Using any of them to diagnose a learning disability, he reported, "resulted in correct decisions only 50% to 55% of the time. Chance would afford similar accuracy."
The measurement literature has pressed this point for decades. McDermott, Fantuzzo and Glutting titled their 1990 critique "Just say no to subtest analysis," Watkins later called cognitive profile analysis "a shared professional myth," and McGill, Dombrowski and Canivez returned to the subject in 2018 under the heading of continued concerns. None of that makes subtest scores worthless. It makes a single scaled score, and the percentile derived from it, a hypothesis for the rest of the evaluation to test, to be read with its confidence interval rather than as a fixed fact. Labels of this kind describe scores, not people.
Reading your own numbers
Converting a scaled score to a percentile is straightforward arithmetic once you know which metric you are holding. Check the range, apply the table above, then resist the pull to interpret any one number alone.
For a broad profile rather than a single subtest figure, the Reasoning and Intelligence Online Test from RIOT IQ is an online IQ test built by psychometricians for adults 18 and over. It runs 15 subtests across six cognitive indices, takes about 52 minutes, and reports on the mean-100, standard-deviation-15 scale. It does not replace an individually administered diagnostic evaluation.
Frequently asked questions
What percentile is a scaled score of 10?
The 50th. A scaled score of 10 is the mean of the Wechsler subtest distribution, so half of the same-age norm group scores at or below it.
What is a good scaled score on a Wechsler subtest?
Pearson describes scaled scores between 8 and 12 as typically average on the WISC-V, roughly the 25th to the 75th percentile. A single subtest is a weak basis for any conclusion.
How do I convert a scaled score to an IQ-scale score?
Multiply the distance from 10 by five and add 100. A scaled score of 14 becomes 120. This puts the subtest on the same metric as index scores, though it does not turn it into an IQ.
Is a scaled score of 13 the same as an IQ of 13?
No. A scaled score of 13 is around the 84th percentile and corresponds to 115 on the IQ metric. An IQ of 13 does not exist, since the Full Scale IQ runs 40 to 160.
Does the 98th percentile mean 98 percent of answers were right?
No. Percentile rank is a ranking against the age-based norm group, not a percentage correct. The 98th percentile means the performance equalled or exceeded that of about 98 percent of same-age peers.
Why do the subtest scores on my report jump around so much?
Because that is typical. In the WISC-III normative sample the average gap between a child's highest and lowest subtest score was 7.5 scaled points, and subtest scores carry more measurement error than composites.
6. Watkins, M. W. (2005). Diagnostic validity of Wechsler subtest scatter. Learning Disabilities: A Contemporary Journal, 3(2), 18-27. files.eric.ed.gov
7. Watkins, M. W. (2000). Cognitive profile analysis: A shared professional myth. School Psychology Quarterly, 15(4), 465-479. doi.org
8. McDermott, P. A., Fantuzzo, J. W., & Glutting, J. J. (1990). Just say no to subtest analysis: A critique on Wechsler theory and practice. Journal of Psychoeducational Assessment, 8(3), 290-302. doi.org
9. McGill, R. J., Dombrowski, S. C., & Canivez, G. L. (2018). Cognitive profile analysis in school psychology: History, issues, and continued concerns. Journal of School Psychology, 71, 108-121. doi.org
Figure: original illustration created for RIOT IQ showing the scaled-score distribution (mean 10, SD 3) and the percentile ranks that correspond to it. It is not a reproduction of any published test material.
Take our professional IQ test
Want to know your IQ? Try the first ever professional online IQ test.