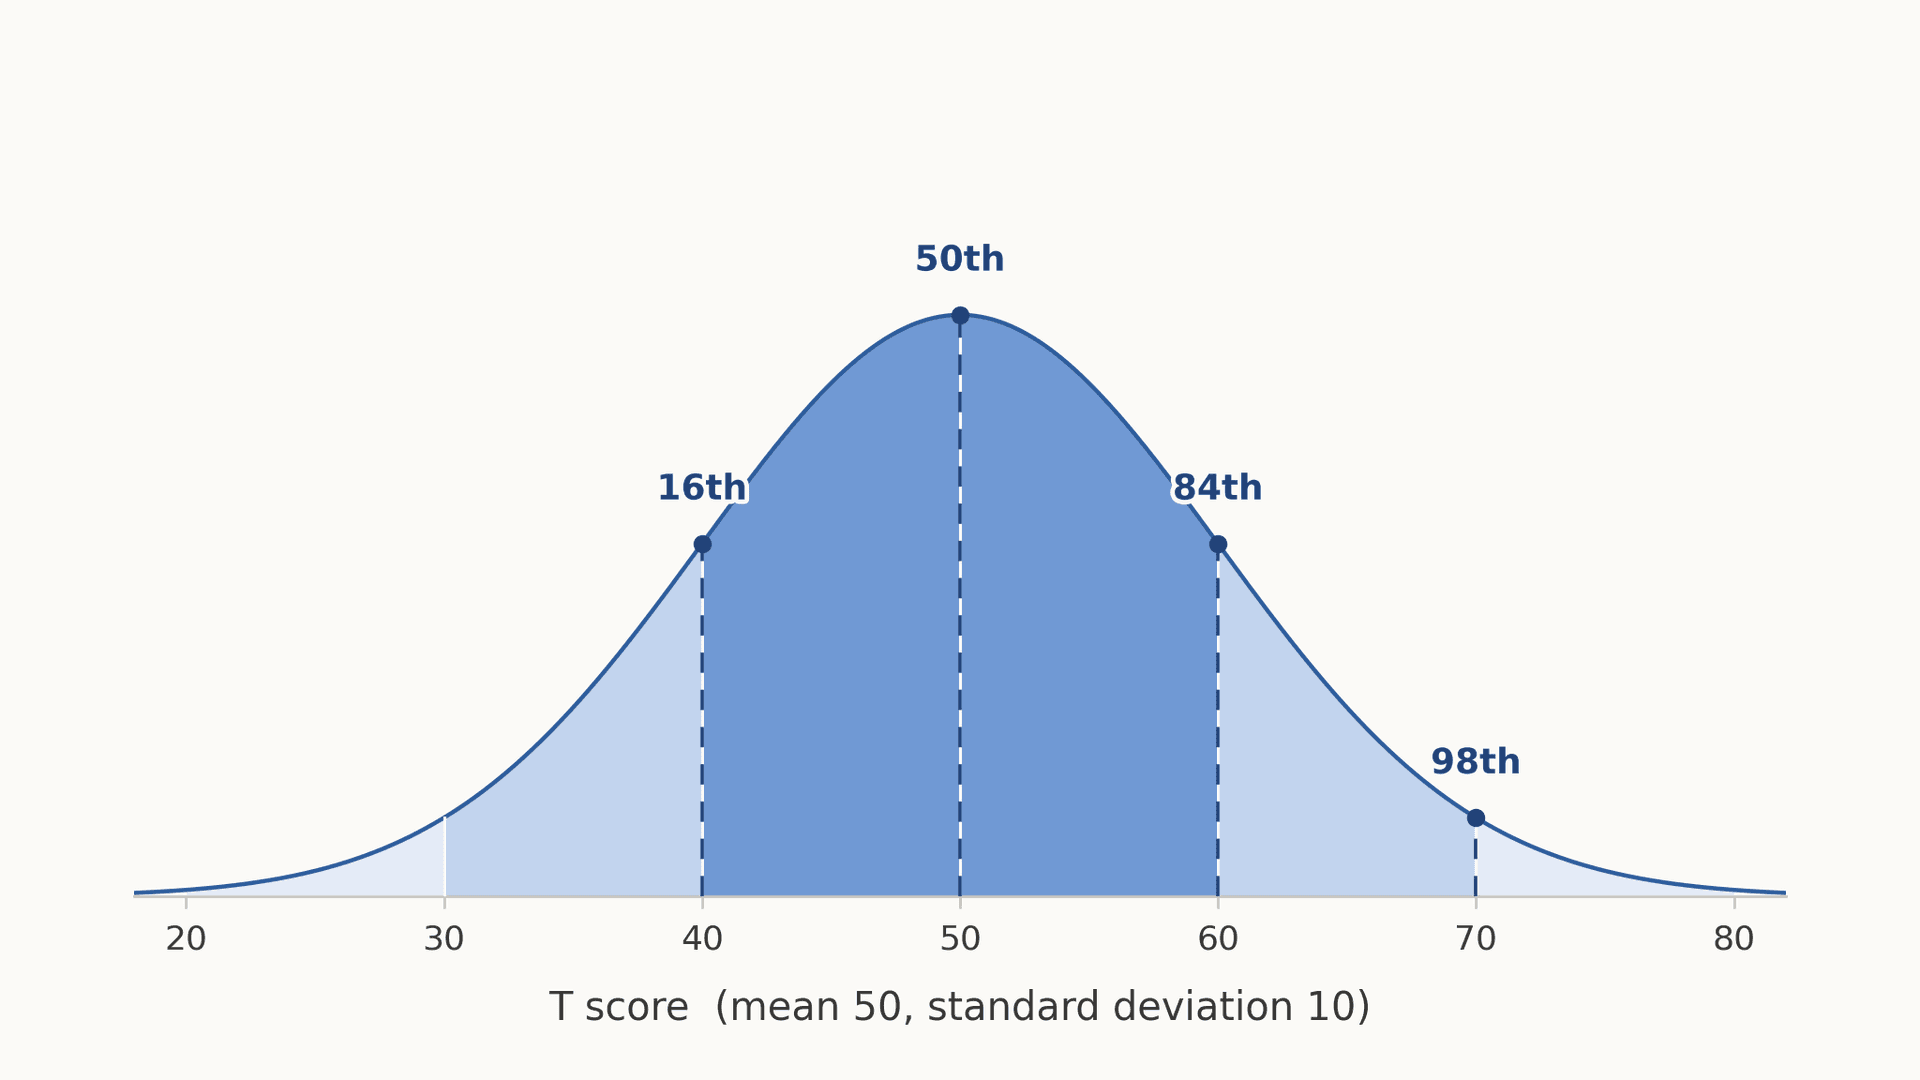
A T score converts to a percentile through the normal curve: T 50 is the 50th percentile, T 60 the 84th, T 70 about the 98th. T scores use mean 50, SD 10.
Dr. Russell T. WarneChief Scientist
Share
A T score converts to a percentile through the normal curve, because the T metric has a mean of 50 and a standard deviation of 10, which is a measure of how spread out scores are. A T of 50 sits at the 50th percentile, a T of 40 at about the 16th, a T of 60 at about the 84th, and a T of 70 at about the 98th. This page covers the T metric only. It does not cover standard scores, index scores or IQ scores (mean 100, standard deviation 15), or Wechsler scaled subtest scores (mean 10, standard deviation 3). Those have their own guides, standard score to percentile and scaled score to percentile. People usually search for this conversion because a T score has turned up on a behaviour or symptom rating scale, where a high score carries the opposite meaning it would on an ability test. That reversal is the most important thing here.
How a T score converts to a percentile
The conversion runs through the "z score," the number of standard deviations a score sits from the mean. For a T score, z equals (T minus 50) divided by 10, and feeding that z into the standard normal distribution gives the proportion of the reference sample expected to score at or below that point. The values below follow from the normal curve alone, so they hold for any instrument whose T scores are normally distributed.
• T score of 30: about the 2nd percentile, two standard deviations below the mean.
• T score of 40: about the 16th percentile.
• T score of 50: the 50th percentile, the average of the reference sample.
• T score of 60: about the 84th percentile.
• T score of 65: about the 93rd percentile.
• T score of 70: about the 98th percentile.
• T score of 80: about the 99.9th percentile.
The three common scoring metrics are the same z score wearing different clothes, so they are comparable by position. A T of 60 sits at the same point on the curve as a standard score of 115 and a Wechsler scaled score of 13; a T of 70 matches a standard score of 130 and a scaled score of 16.
A percentile rank is not a percentage correct, and it is not an equal-interval scale, so equal steps in T cover very unequal stretches of percentile. Moving from T 50 to T 55 gains about 19 percentile points; moving from T 70 to T 75 gains under 2. Our guide to IQ percentiles works through that property.
Why a high T score usually means more of a problem
T scores appear most often on behaviour and symptom rating scales rather than ability tests. The BASC-3, the Conners 4, the BRIEF2, the ASEBA forms including the Child Behavior Checklist, and the MMPI family all report results in T scores. HealthMeasures, which publishes the PROMIS measures on the same metric, states the interpretive rule plainly: "A higher T-score means more of the concept being measured."
On a symptom scale the concept being measured is the problem. In Pearson's published BASC-3 sample report, a Hyperactivity T score of 80 carries a percentile rank of 99 and the classification "Clinically Significant," and such a score "usually warrants follow-up assessment or intervention." Being at the 98th percentile on an ability index is a strength. Being at the 98th percentile on a symptom scale means a rater endorsed more problem behaviours than roughly 98 out of 100 raters of same-age children.
The same instrument can flip direction within one report. The BASC-3 also has adaptive scales, where the content is skill rather than symptom, and in that sample report a Leadership T score of 33 sits at the 6th percentile and is flagged "At-Risk," because there the low end is the concern. A T of 70 on a measure of skill and a T of 70 on a measure of symptoms describe an identical position on the curve and opposite situations. Before reading any T score, establish which direction the scale runs.
Where the at-risk and clinically significant lines fall
Rating scales attach verbal labels to T score bands, and those labels drive referral decisions more than the raw percentile does. Each publisher sets its own bands, so check them against the manual for the instrument in front of you.
The BASC-3 is the clearest worked example. Its clinical scales use an "At-Risk" band from T 60 through T 69 and a "Clinically Significant" band at T 70 and above. Pearson's own sample materials show the rule in action: T scores of 65 and 68 fall in the At-Risk range, while 70, 73 and 83 are all Clinically Significant. Pearson describes scores in the Clinically Significant range as suggesting "a high level of maladjustment," and scores in the At-Risk range as possibly identifying "a significant problem that may not be severe enough to require formal treatment."
Other publishers cut the same region differently.
• Conners 4: Multi-Health Systems publishes a five-band table: Very Elevated at T 70 and above (98th percentile and up), Elevated at T 65 to 69 (93rd to 97th), Slightly Elevated at T 60 to 64 (84th to 92nd), Average at T 40 to 59 (16th to 83rd), and Low below T 40. The 60s are split in two rather than treated as a single at-risk band.
• BRIEF2: PAR, publisher of the Behavior Rating Inventory of Executive Function, Second Edition, treats a clinical scale as elevated at T of 60 or above.
• ASEBA forms: the CBCL/6-18 profile published by ASEBA flags syndrome-scale T scores of 66 and 68 as the borderline clinical range, and T scores of 70 and above as the clinical range.
The 60 and 70 landmarks recur because they mark one and two standard deviations above the mean. What differs is where a publisher draws lines inside that region and what it calls the result, which is why quoting "T 70 is clinically significant" without naming the scale is unsafe.
Uniform T scores and linear T scores
The conversion table quietly assumes one thing. A "linear T score" rescales the raw score distribution to a mean of 50 and a standard deviation of 10 while leaving its shape untouched. Problem scales usually have raw scores piled up at the low end, so the T distribution stays skewed, and a given T can land at a different percentile on different scales of one test.
Pearson's MMPI-3 technical manual describes this failure and the fix. Because the raw-score distributions for the MMPI Clinical Scales were differentially skewed, under linear T scores "the same T-score value did not necessarily correspond to the same percentile for different scales," which "made direct comparisons of T scores on different Clinical Scales potentially misleading." Tellegen and Ben-Porath answered that in 1992 by computing an average distribution across the eight original clinical scales and adjusting each scale to fit the composite, which the manual says "yielded percentile-equivalent T scores while retaining the skewed nature of the distributions." Those are "uniform T scores," and they have since been adopted for the MMPI-2-RF substantive scales and the MMPI-3.
The practical consequence is that the percentile printed beside a T score is usually the better number to trust. In Pearson's BASC-3 examples a T score of 70 is paired with a percentile rank of 95 on one composite and 96 on another, rather than the 98 the normal curve gives, because the reported ranks come from the actual norm sample. Multi-Health Systems describes the Conners 4 percentiles the same way, as "the empirical percentile ranks based on responses from the selected reference sample(s)." Use the normal curve table as the mental model and the report's percentile column as the answer.
What a T score cannot tell you on its own
A T score is an estimate, and it carries "measurement error," the ordinary imprecision of any test score. Publishers say so themselves. The Conners 4 manual warns that T scores of 69 and 70 fall in different categories, Elevated and Very Elevated, "even though there is no significant difference between these scores." Pearson attaches the same caution to BASC-3 classifications, noting they are all "subject to the application of the standard error of measurement." That is why reports print a confidence interval around each T score, and why it belongs in any sentence using a score to justify a decision.
One disambiguation is worth making, since searchers arrive from both directions. The T score on this page is not Student's t statistic, which compares group means and has no fixed mean or standard deviation. The shared letter is a coincidence of notation.
A T score is also defined entirely by the reference sample it was normed against, so the same responses can yield different T scores under a general norm group and under a gender-specific or clinical one. And a band label describes a score. "At-Risk" says where one rater's ratings fell relative to a norm group on one day.
If you came here wanting a picture of your own cognitive abilities rather than a rating-scale profile, the Reasoning and Intelligence Online Test is a professionally developed IQ test built for adults 18 and over by RIOT IQ with psychometrician Dr. Russell T. Warne. It runs 15 subtests across six cognitive indices, takes about 52 minutes, and reports on the mean-100, standard-deviation-15 metric with confidence intervals attached.
Frequently asked questions
What percentile is a T score of 60?
A T score of 60 sits one standard deviation above the mean and falls at about the 84th percentile of the reference sample. On a symptom scale that usually means more of the problem than roughly 84 percent of the norm group, not a better result.
Is a high T score good or bad?
It depends entirely on what the scale measures. A higher T score means more of the concept being measured, so it is unfavourable on a symptom or problem scale and favourable on a skill, ability or adaptive scale.
What T score is considered clinically significant?
That is set by each publisher, so name the instrument. The BASC-3 uses T 70 and above for its Clinically Significant band and T 60 to 69 for At-Risk, the Conners 4 calls T 70 and above Very Elevated, and the BRIEF2 treats a clinical scale as elevated from T 60.
How do I convert a T score to an IQ score?
Convert through the z score. Subtract 50, divide by 10, multiply by 15, then add 100. A T of 60 corresponds in position to a standard score of 115 and a T of 70 to 130, though a rating-scale T score and an IQ measure entirely different things.
Why does my report's percentile differ from the normal curve value?
Most publishers print empirical percentile ranks taken from the actual distribution of the norm sample, which is often skewed on problem scales. Trust the percentile printed beside the score.
4. Ben-Porath, Y. S., & Tellegen, A. (2020). MMPI-3 technical manual, chapter 1. University of Minnesota Press, distributed by NCS Pearson. pearsonassessments.com
5. Tellegen, A., & Ben-Porath, Y. S. (1992). The new uniform T scores for the MMPI-2: Rationale, derivation, and appraisal. Psychological Assessment, 4(2), 145-155. doi.org
6. Achenbach, T. M. (2024). CBCL/6-18 profile with DSM-5 scales (sample report). ASEBA, University of Vermont. aseba.org
7. PAR. Behavior Rating Inventory of Executive Function, Second Edition (BRIEF2). PAR Inc. parinc.com
Figure: original illustration created for RIOT IQ showing the T-score distribution (mean 50, SD 10) and the percentile ranks that correspond to it. It is not a reproduction of any published test material.
Take our professional IQ test
Want to know your IQ? Try the first ever professional online IQ test.