Stanine scores explained: the nine-point standard scale
A stanine is a score on a nine-point standard scale with a mean of 5 and a standard deviation of 2. Here is the band table and what each stanine means.
Dr. Russell T. WarneChief Scientist
Share
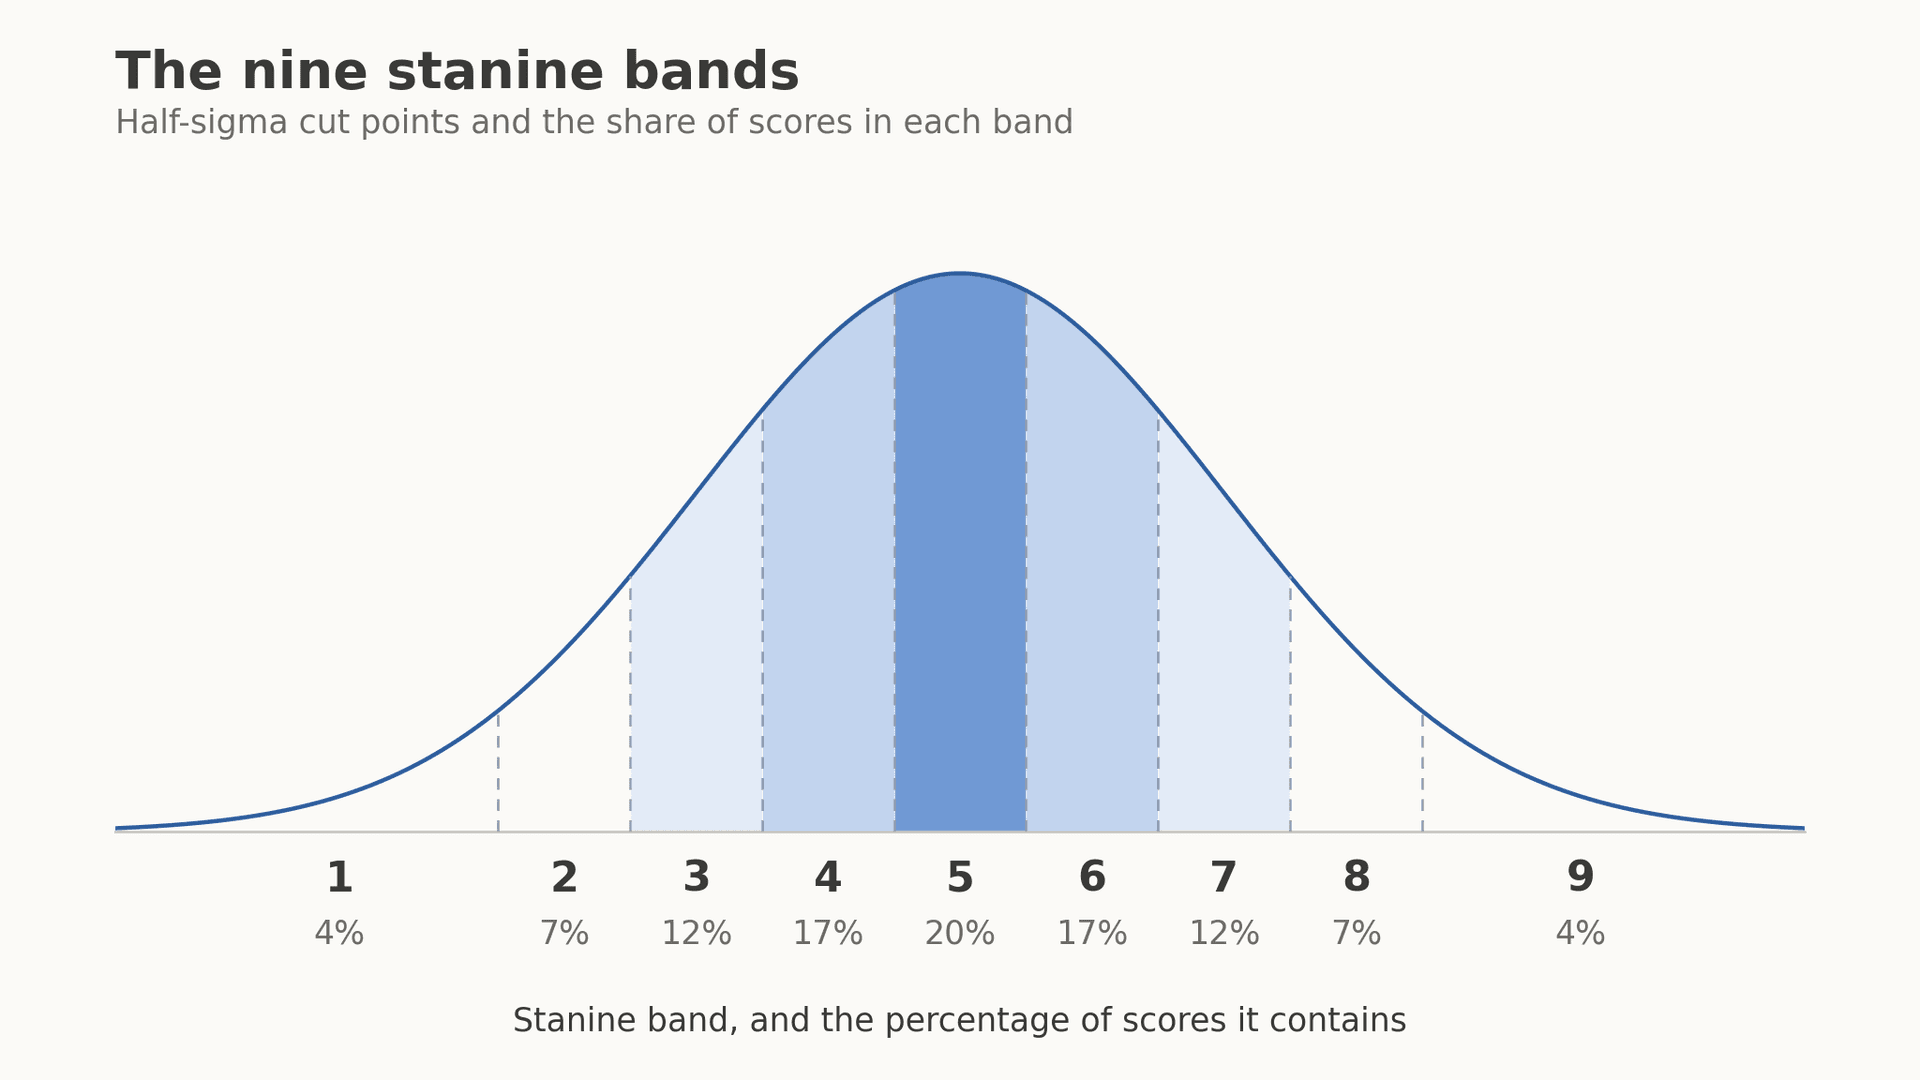
A "stanine" is a normalized standard score reported on a single-digit scale running from 1 to 9, with a mean of 5 and a standard deviation of 2. The name is a contraction of "standard nine." Each band except the top and bottom one covers half a standard deviation of the score distribution, so the nine bands hold a fixed share of the reference group: 4 percent, 7, 12, 17, 20, 17, 12, 7 and 4 percent, from stanine 1 up to stanine 9.
A stanine score is a way of reporting where a person stands, not a separate kind of ability measurement. This page covers the band table, where the scale came from, where it is still used, how it lines up against the IQ metric, and the limitation that follows from squeezing a continuous distribution into nine boxes.
The stanine band table
These are the published figures. The percentile columns are taken from the Australian Council for Educational Research's guide to interpreting its Progressive Achievement Tests, and the standard-deviation cut points from Harold Seashore's 1955 account of standard score systems for The Psychological Corporation.
• Stanine 1, bottom 4 percent: Percentile ranks 0 to 4. All scores below 1.75 standard deviations under the mean. ACER labels this band "very low."
• Stanine 2, next 7 percent: Percentile ranks 4 to 11, between 1.75 and 1.25 standard deviations below the mean. Labeled "low."
• Stanine 3, next 12 percent: Percentile ranks 11 to 23, between 1.25 and 0.75 standard deviations below the mean. Labeled "below average."
• Stanine 4, next 17 percent: Percentile ranks 23 to 40, between 0.75 and 0.25 standard deviations below the mean. The first of the three bands ACER calls "average."
• Stanine 5, middle 20 percent: Percentile ranks 40 to 60. This is the band within 0.25 standard deviations either side of the mean, and it is the largest because the normal curve is at its tallest there.
• Stanine 6, next 17 percent: Percentile ranks 60 to 77, between 0.25 and 0.75 standard deviations above the mean. Still "average."
• Stanine 7, next 12 percent: Percentile ranks 77 to 89, between 0.75 and 1.25 standard deviations above the mean. Labeled "above average."
• Stanine 8, next 7 percent: Percentile ranks 89 to 96, between 1.25 and 1.75 standard deviations above the mean. Labeled "high."
• Stanine 9, top 4 percent: Percentile ranks 96 and above, everything past 1.75 standard deviations. Labeled "very high."
The percentages are symmetrical and sum to 100 by construction. One small point of precision is worth making, since the round numbers are approximations of a continuous curve. Seashore states the design target as a mean of 5.0 and a standard deviation of 2.0, and the standard deviation implied by the rounded percentages above works out to about 1.96. Treating the stanine standard deviation as 2 is accurate enough for every practical purpose.
Where the scale came from
The stanine was built during the Second World War by the psychologists of the United States Army Air Forces Aviation Psychology Program, and Seashore credits it to them directly. The program's problem was volume. With the pre-war college requirement for aircrew dropped, well over a million young men sat the AAF Qualifying Examination, and roughly 650,000 passed it and had to be sorted into pilot, navigator and bombardier training.
The program's answer was to compress each candidate's whole classification battery into one digit. A candidate received a pilot stanine, a navigator stanine and a bombardier stanine, each weighting the same battery differently for its own criterion, and the resulting single digits drove the assignment decision. The published validity evidence was blunt. A candidate with a pilot stanine of 9 had only about 4 chances in 100 of failing primary pilot training, while a candidate with a pilot stanine of 1 had 77 chances in 100 of failing. By June 1945 a stanine of 7 or above was the standard required to qualify for pilot, navigator or bombardier training.
The nine-point design served that operational need. Every score was a single digit, so a candidate's standing on each criterion took one character to record, file and sort, and nine categories were enough to rank hundreds of thousands of applicants without implying a precision the battery did not have. The choice of nine rather than some other number is what gives the scale its name.
Where stanines are still used
Stanines never migrated into individually administered clinical IQ testing, where scores are reported on the mean-100 metric. They stayed in group testing, and they are still standard there.
• Group achievement and ability batteries: Riverside Insights reports stanines on both the Iowa Assessments and the Cognitive Abilities Test, defining them as normalized standard scores that range from 1 to 9 with an average value of 5. Reports distinguish a national stanine, which ranks a student against a nationally representative sample, from a local stanine based on the district's or school's own data.
• School reports to parents and teachers: ACER's Progressive Achievement Tests, used widely in Australian and New Zealand schools, print a stanine beside the scale score and percentile rank in every norm table, and ACER notes that stanines are particularly useful for grouping students.
• Age-based and grade-based versions: The same performance can produce two different stanines depending on the comparison group. Riverside's norms guide for the Cognitive Abilities Test tabulates percentile rank, normal curve equivalent and stanine equivalents of standard age scores separately from the grade-based tables, so a student's age stanine and grade stanine will not always match.
The reason for the scale's survival is practical. A single digit is easy to read, hard to over-interpret, and easy to compare across subject areas on one line of a report card.
Stanines and the IQ metric
Stanines and IQ scores are both normalized standard scores, so they describe the same underlying distribution on different rulers. The IQ metric uses a mean of 100 and a standard deviation of 15; the stanine scale uses a mean of 5 and a standard deviation of 2. Applying the standard-deviation cut points above to the IQ scale gives the rough correspondence: stanine 5 covers about IQ 96 to 104, stanine 7 about 111 to 119, stanine 9 about 126 and up, and stanine 1 about 74 and below.
Read those as orientation rather than as a conversion. A stanine on a reading comprehension test and an IQ score from a cognitive battery come from different norm groups and measure different things, and lining up the numbers does not make them interchangeable. For the mechanics of moving between score metrics, see our guide to converting a standard score to a percentile, and for what a rank in the reference group actually means, our explainer on IQ percentiles.
The honest limitation: nine bands are coarse
Everything that makes the stanine convenient also makes it blunt, and the publishers say so themselves.
• A one-band difference may be nothing at all: ACER's guidance is explicit that only differences of two or more stanines should be regarded as indicating a real difference in performance. A gap of one stanine between two subjects, or between two testings of the same student, sits comfortably inside the measurement error of most group tests. Our page on the standard error of measurement covers how that error is quantified.
• Adjacent stanines can hide a large gap: Because the bands are wide, two students one band apart can be very close in raw performance while two students in the same band can be far apart. A student at the 24th percentile and one at the 39th both receive a stanine of 4, and ACER describes the stanine as a coarser ranking than the percentile rank for exactly this reason.
• The end bands are open: Stanine 9 contains everyone at or above the 96th percentile, which on the IQ metric would stretch from roughly 126 upward with no ceiling. A scale designed to sort a large middle group is least informative where selection decisions are often made, and precision is already weakest at the extremes, which is why the Standards for Educational and Psychological Testing ask publishers to report conditional standard errors at several score levels rather than one average for the whole test.
• A single raw point can move a band: Near a band boundary, one additional correct answer can shift a reported stanine. The underlying score changed by a trivial amount, and the label changed by a whole category.
None of this makes the stanine a bad scale. It makes it a reporting format with a known resolution, best used to group and to flag rather than to rank individuals finely or to track small changes over time. The same caution applies to any single score from any test, which is why a well-built assessment reports a range alongside a point estimate. Readers who want a professionally developed IQ test with published norms and documented precision can take the Reasoning and Intelligence Online Test directly.
Frequently asked questions
Is a stanine score of 5 good?
A stanine of 5 is the exact middle of the scale and covers the central 20 percent of the reference group, percentile ranks 40 to 60. ACER classifies stanines 4, 5 and 6 together as average.
What does a stanine score of 9 mean?
It means a score at or above the 96th percentile of the norm group, the top 4 percent. It is the highest band on the scale, and it is open-ended, so it does not distinguish between a score at the 96th percentile and one at the 99.9th.
Is a stanine the same as a percentile?
No. A percentile rank places a score at one of 99 positions; a stanine collapses the same distribution into nine. Stanines are derived from percentile ranks, so the information flows one way: you can convert a percentile into a stanine, but not a stanine back into a precise percentile.
What does stanine stand for?
It is a contraction of "standard nine," describing a standard score scale with nine categories. The term dates from the Army Air Forces testing program of the 1940s.
Can stanines be averaged?
Averaging stanines is poor practice, for the same reason averaging percentile ranks is. The bands are broad and unequal in width on the underlying score scale, so an average of two stanines does not correspond to any meaningful point on the distribution.
References
1. Army Air Forces, Office of the Air Surgeon, Aviation Psychology Program. (1947). Stanines: Selection and classification for air crew duty. Aviation Psychology Program, Office of the Air Surgeon. collections.nlm.nih.gov
2. Seashore, H. G. (1955). Methods of expressing test scores. Test Service Bulletin, No. 48, 7-10. The Psychological Corporation. files.eric.ed.gov
3. Australian Council for Educational Research. (2011). Interpreting ACER test results. ACER. acer.org
5. American Psychological Association. Stanine. APA Dictionary of Psychology. dictionary.apa.org
6. American Educational Research Association, American Psychological Association, & National Council on Measurement in Education. (2014). Standards for educational and psychological testing. AERA. testingstandards.net
7. Riverside Insights. (2020). CogAT Form 7/8 complete norms and score conversions guide. Riverside Insights. onlinehelp.riversideinsights.com
Figure: original illustration created for RIOT IQ, plotting the stanine cut points given by Seashore (1955) and the band percentages published by the Australian Council for Educational Research (2011). It is not a reproduction of any published figure.
Take our professional IQ test
Want to know your IQ? Try the first ever professional online IQ test.