The IQ bell curve is the normal distribution IQ scores follow: average 100, standard deviation 15. Learn the 68-95-99.7 rule and what percentiles mean.
Dr. Russell T. WarneChief Scientist
Share
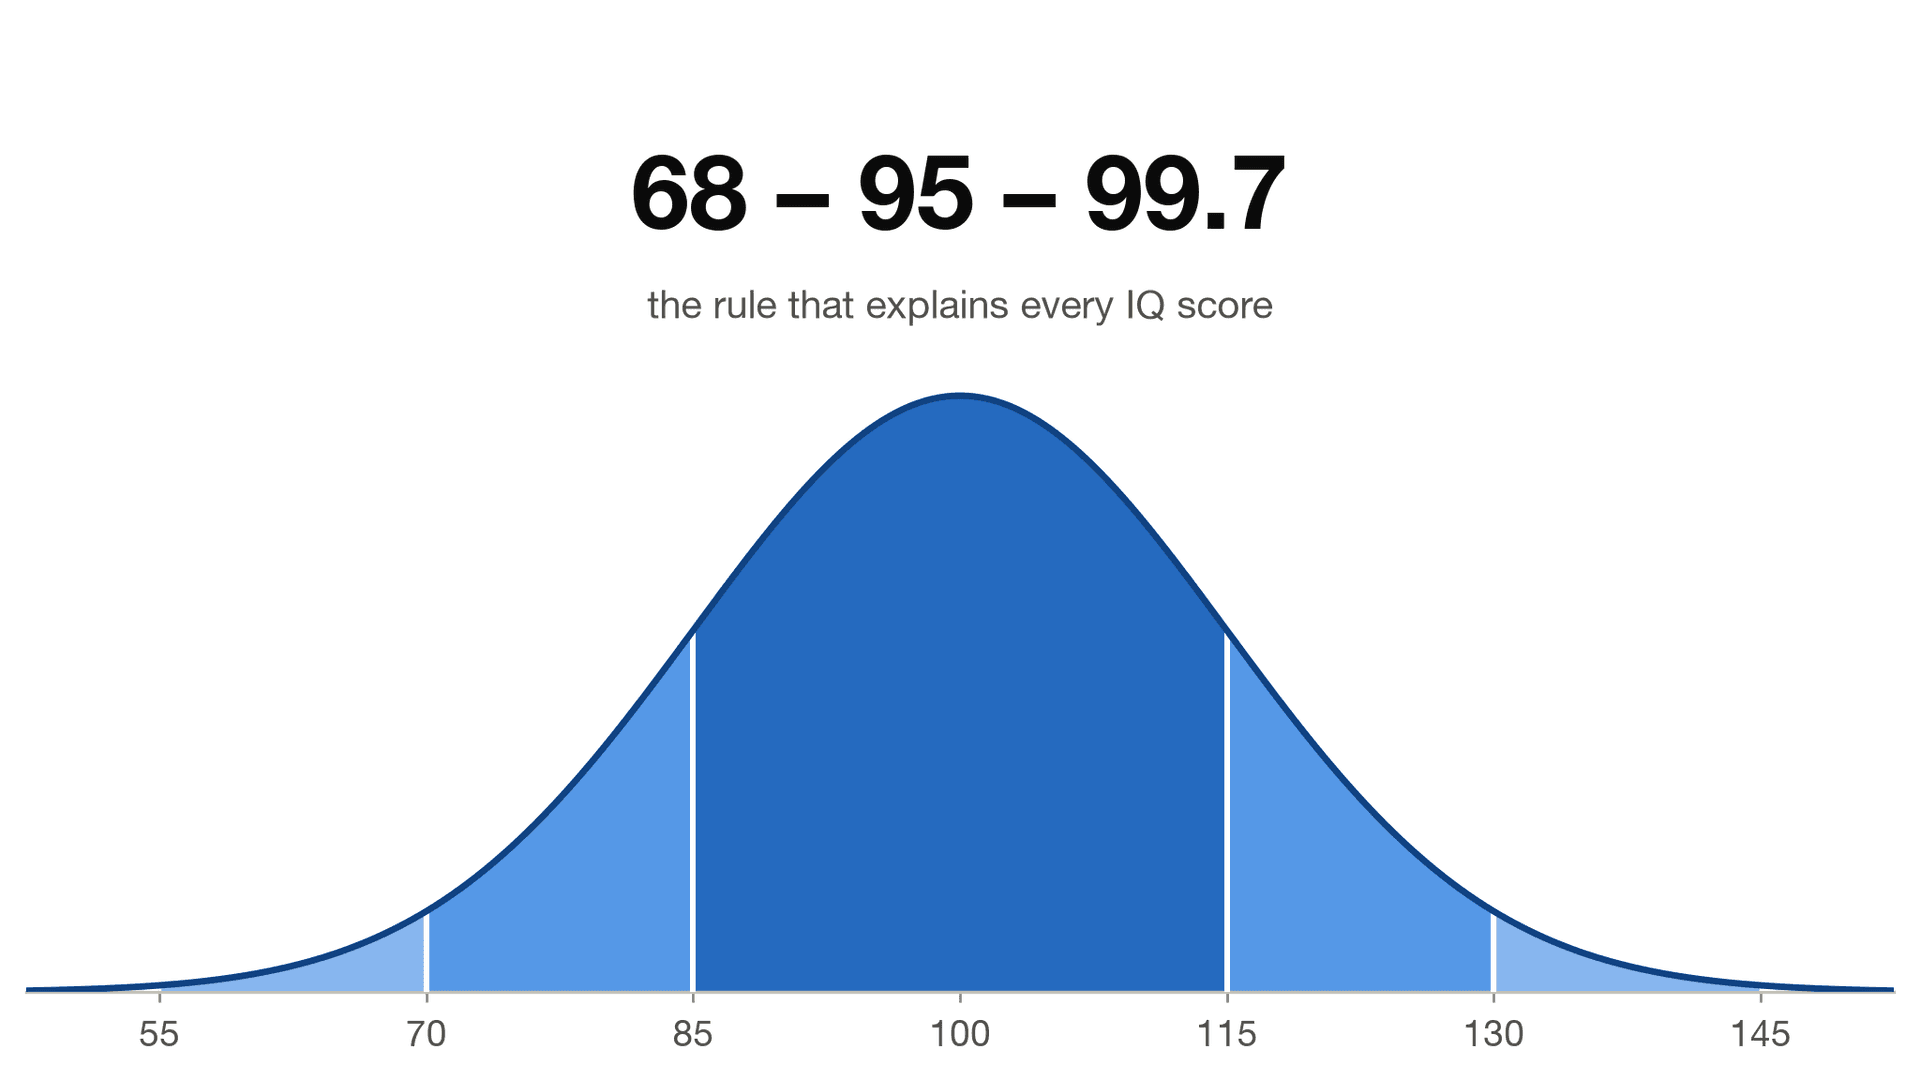
The IQ bell curve is the “normal distribution” that IQ scores are scaled to follow: a symmetric curve centered at 100, where a “standard deviation,” a measure of spread, equals 15 points. Its shape is summarized by the 68-95-99.7 rule: about 68% of people score within one standard deviation of the average (85 to 115), about 95% within two (70 to 130), and about 99.7% within three (55 to 145). Once you can read the curve, every IQ number turns into a percentile, a rarity, and a range.
Why IQ Scores Follow a Bell Curve
Nature does not print IQ scores; tests are deliberately built this way. Raw performance, the number of items answered correctly, is converted onto the normal curve by comparing each person with a “norm group,” a large representative sample. There is a substantive reason this works: cognitive ability, like height, reflects many small genetic and environmental influences added together, and quantities built from many small influences tend toward a normal distribution. The scaling then standardizes what testing observes. Our article on why 100 is the average IQ covers the history of that choice.
Reading the Curve: From Score to Percentile
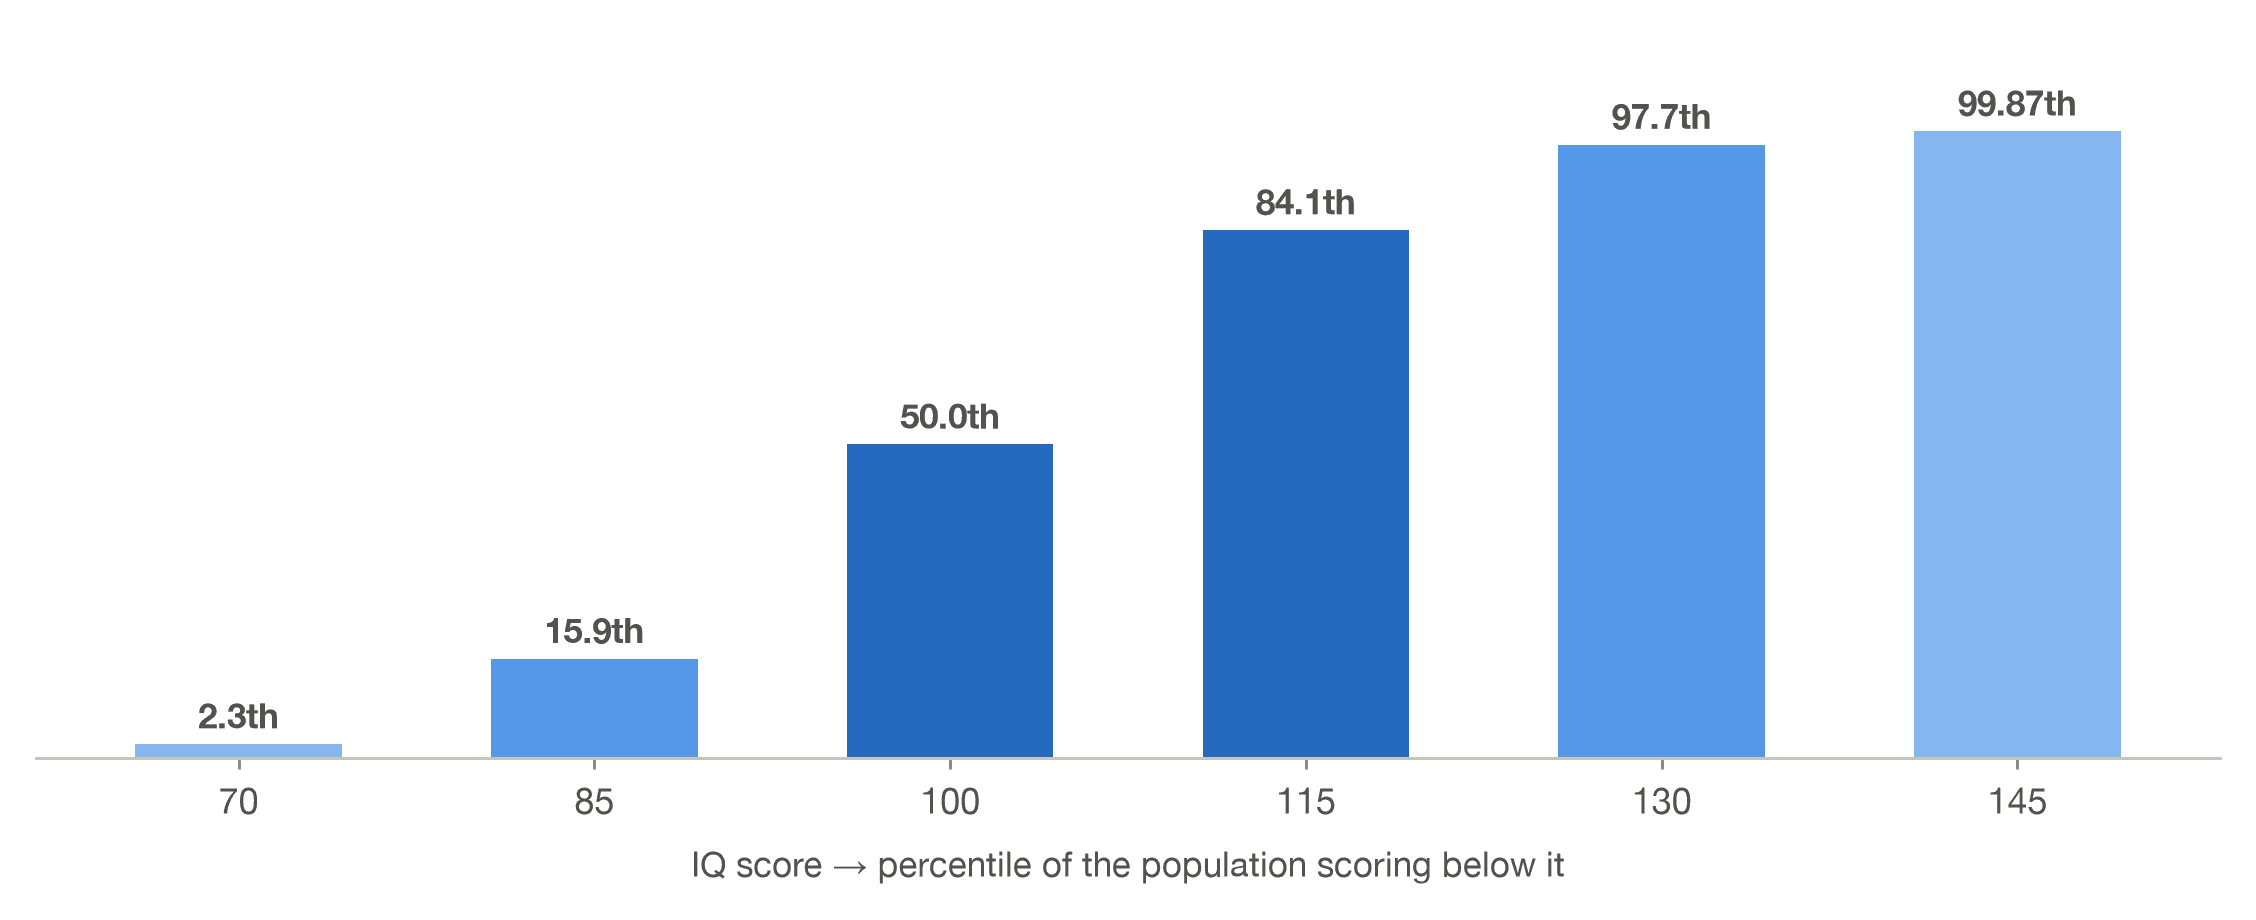
The curve's most practical use is converting scores to percentiles, the share of people scoring below you.
A score of 115 beats about 84% of the population; 130 beats about 98%; 145 beats about 99.9%. Working downward mirrors the same steps: 85 sits at the 16th percentile and 70 at the 2nd. These percentile equivalences are fixed properties of the scale, which is what makes scores comparable across modern, properly normed tests. The full classification bands are laid out in our guide to the IQ scale.
One refinement keeps percentile talk honest: every score carries measurement error. A reported 115 with a typical “standard error of measurement” of about 3 points is best read as “very likely between 109 and 121,” which spans roughly the 73rd to 92nd percentile. Good score reports present that band; percentile points are the map, not the territory.
A Curve That Moves: Renorming and the Flynn Effect
The bell curve is anchored to its norm group, and norm groups age. Raw performance has drifted upward for a century, a phenomenon called the “Flynn effect,” at roughly three points per decade worldwide according to the Pietschnig and Voracek meta-analysis. Test publishers respond by renorming every decade or two, pulling the curve's anchor back to 100. The practical consequence: a score from a test with 30-year-old norms is inflated by several points relative to a modern test, which is one of several reasons scores from different eras cannot be compared casually.
The Tails: Where Scores Get Rare Fast
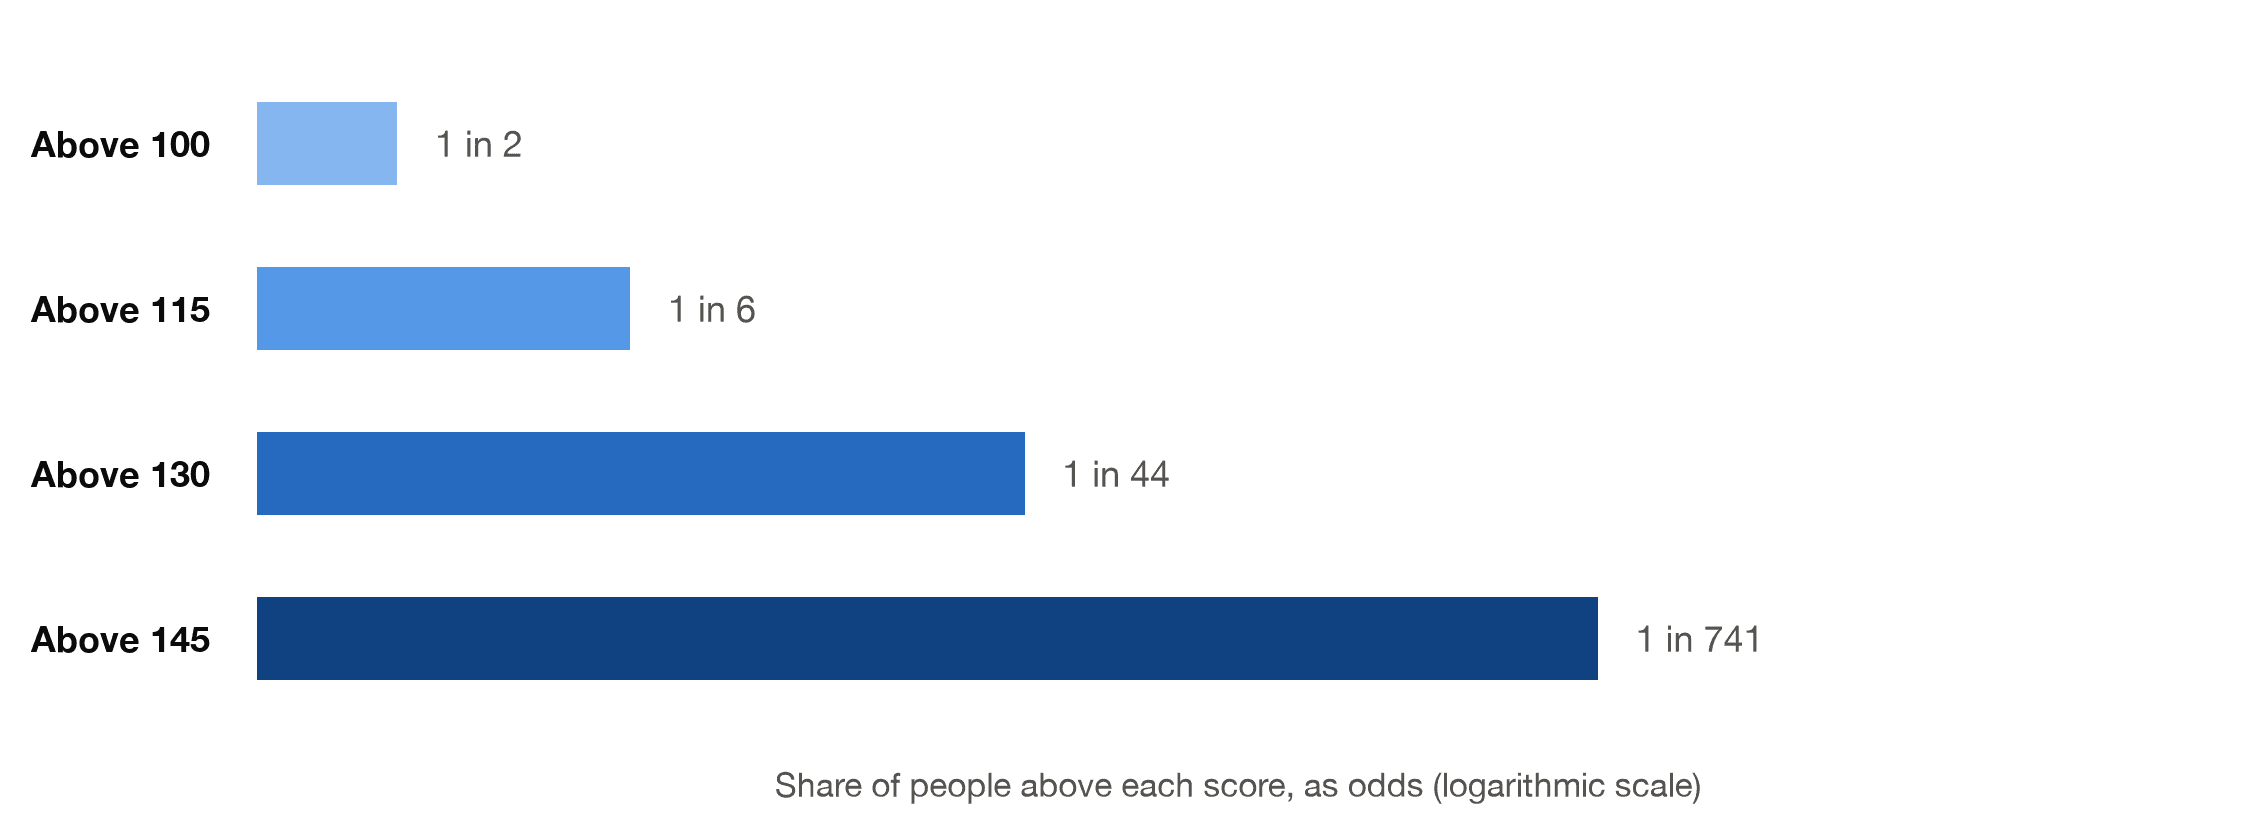
The curve's steep sides mean rarity accelerates non-linearly. Moving from 100 to 115 changes you from one-in-two to one-in-six; the same 15-point move from 130 to 145 changes you from one-in-44 to one-in-741.
This acceleration is why claims about extreme scores deserve scrutiny, and why tests stop measuring precisely somewhere in the 150s: norm samples simply run out of people. Our articles on the highest possible IQ and genius IQ scores cover the far-right tail in detail.
How Test Makers Build the Curve
Turning raw answers into a bell curve is a deliberate manufacturing process called “norming.” The publisher recruits a standardization sample, thousands of people chosen to mirror the population in age, sex, region, and education, and administers the final item set under standard conditions. Raw scores from that sample define the conversion tables: the median performance is assigned 100, and the spread is stretched or compressed so one standard deviation equals exactly 15 points at every age band. Quality standards for that process, from sampling to reporting, are codified in the professional testing standards jointly published by the AERA, APA, and NCME. It is expensive, which is why properly normed tests are rare and free online quizzes that skip the step produce numbers with no meaning.
What the Bell Curve Does Not Say
• It is not a report card on individuals: The curve describes populations. Any individual score still carries measurement error of several points, so small differences between people are noise.
• It does not make 100 mediocre: Half of humanity scores within 10 points of 100. The curve's bulk is the norm, not a failure zone.
• It is not destiny: Percentiles describe standing on one kind of measure. They predict outcomes statistically, not individually, and they say nothing about worth.
See Where You Sit on the Curve
The Reasoning and Intelligence Online Test, developed by a team led by intelligence researcher Dr. Russell T. Warne, reports your score on this exact scale, with the percentile and the confidence band shown so the curve's honesty carries through to your report. Take the RIOT IQ test.
Frequently Asked Questions
What does the IQ bell curve show?
How scores distribute across the population: most people near 100, with frequencies falling symmetrically and fast as scores move toward either tail.
What is the 68-95-99.7 rule for IQ?
About 68% of people score 85 to 115, about 95% score 70 to 130, and about 99.7% score 55 to 145.
What percentile is an IQ of 120?
Roughly the 91st percentile: about nine people in ten score below 120 on a modern SD-15 test.
Why is the average IQ exactly 100?
By design. Test makers set the norm group's mean to 100 and renorm periodically so the anchor holds as populations change.
Is the bell curve the same as the controversial book?
No. The statistical curve long predates the 1994 book that borrowed its name; this article is about the statistics, which are uncontroversial.
References
1. American Educational Research Association, American Psychological Association, & National Council on Measurement in Education. (2014). Standards for educational and psychological testing. American Educational Research Association. testingstandards.net
3. Gottfredson, L. S. (1997). Mainstream science on intelligence: An editorial with 52 signatories, history, and bibliography. Intelligence, 24(1), 13–23. doi.org/10.1016/S0160-2896(97)90011-8
4. Pietschnig, J., & Voracek, M. (2015). One century of global IQ gains: A formal meta-analysis of the Flynn effect (1909–2013). Perspectives on Psychological Science, 10(3), 282–306. doi.org/10.1177/1745691615577701
5. Warne, R. T. (2020). In the know: Debunking 35 myths about human intelligence. Cambridge University Press. doi.org/10.1017/9781108593298
Take our professional IQ test
Want to know your IQ? Try the first ever professional online IQ test.