Standard score to percentile: how the conversion works
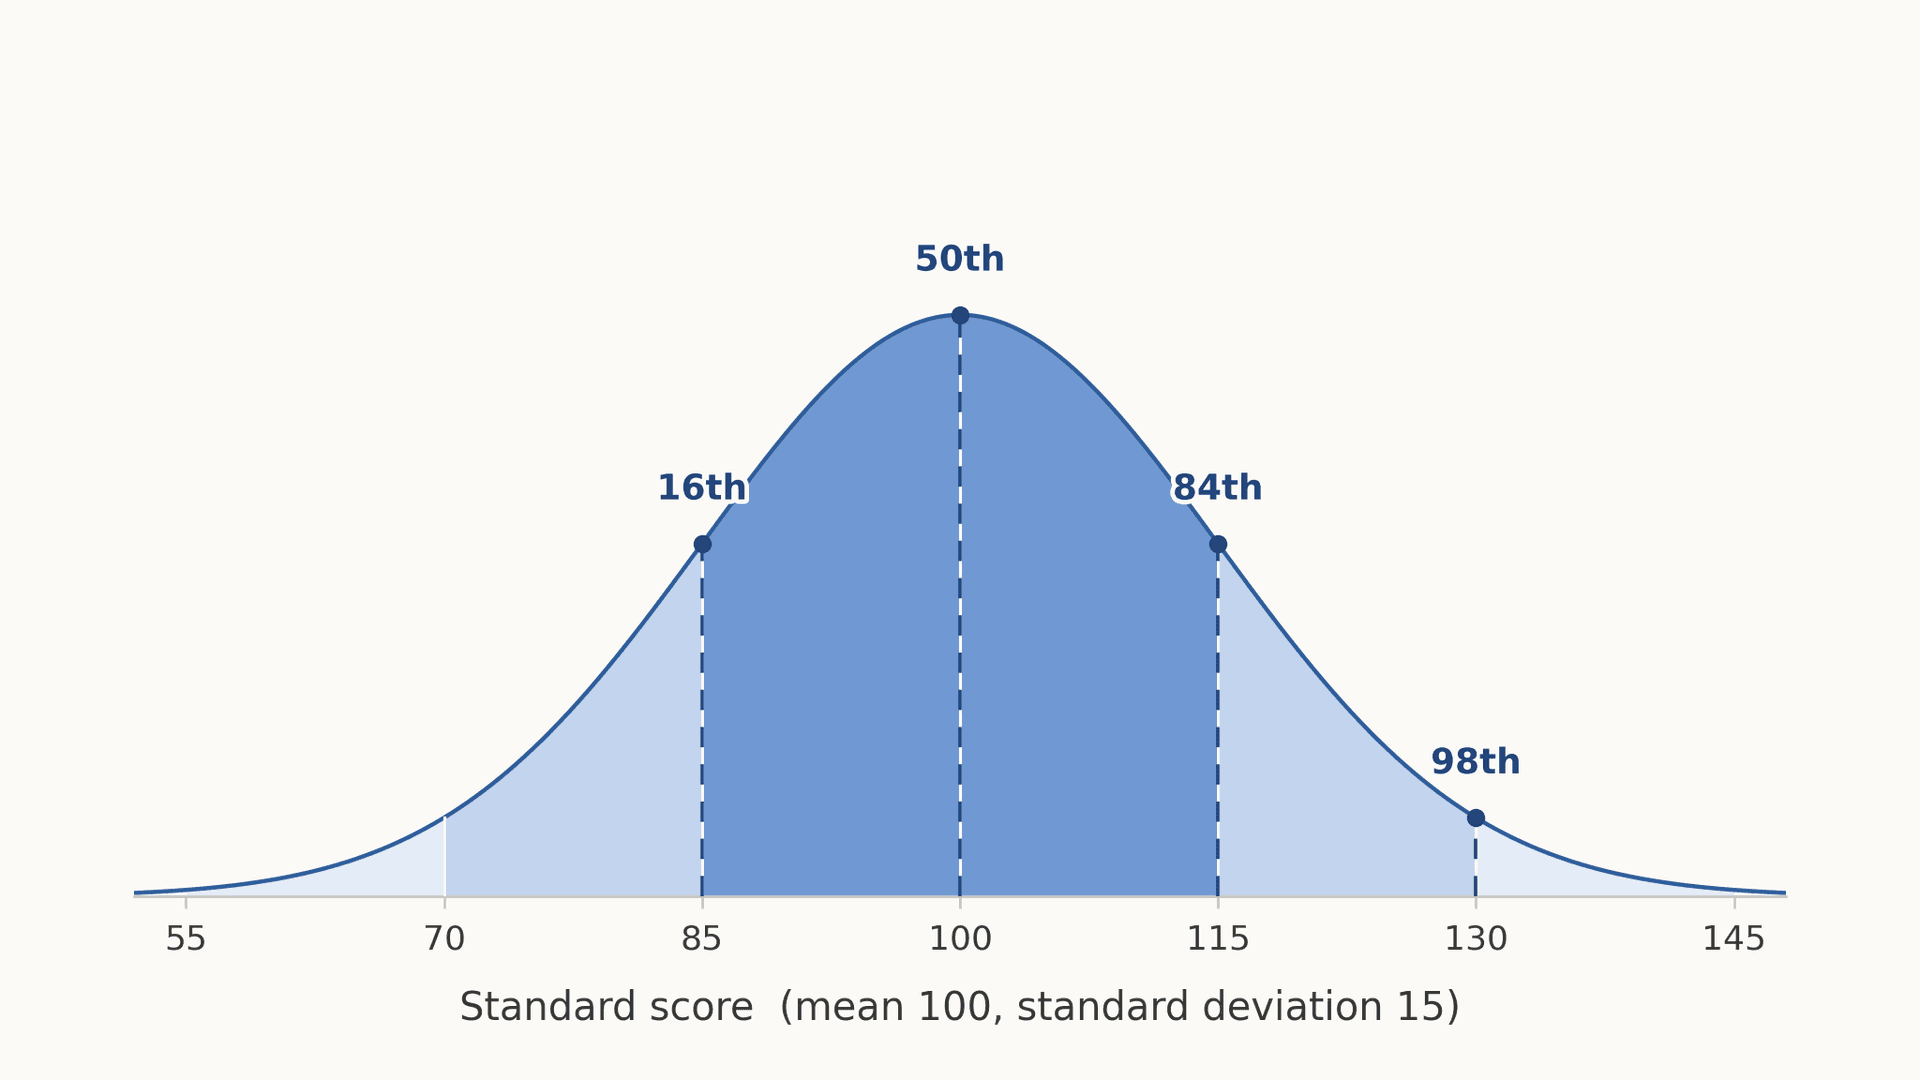
A standard score converts to a percentile through the normal curve: 100 sits at the 50th percentile, 115 at the 84th, 130 at the 98th. Full table inside.
Dr. Russell T. WarneChief Scientist
Share
A standard score converts to a percentile by reading its position on the normal curve, and on the mean-100, standard-deviation-15 metric the anchors are fixed: 100 is the 50th percentile, 115 is the 84th, and 130 is the 98th. That metric is the one used for IQ scores, for Wechsler index scores, and for most achievement-test standard scores, and it is the only metric this article covers. Two other common metrics work the same way but have different anchors, so they get their own pages: scaled subtest scores run on a mean of 10 with a standard deviation of 3, and T scores run on a mean of 50 with a standard deviation of 10. Reading a scaled score off a standard-score table produces nonsense.
Why the normal curve does the work
A "percentile rank" is a rank, not a quantity of anything. The Standards for Educational and Psychological Testing define it as the rank of a given score based on the percentage of scores in a specified distribution that fall below it. A standard score states a position in standard-deviation units from the mean of a reference group. Converting one into the other is possible only because publishers build their scales so the distribution of scores in the norm sample approximates a normal curve.
Once the shape is fixed, the arithmetic is fixed with it. The "standard deviation," a measure of how spread out scores are, is 15 points here. A score of 115 sits exactly one standard deviation above the mean, and 84.13 percent of a normal curve lies below that point. No judgment is involved and no lookup table is required; the percentile follows from the geometry. Our explainer on the IQ bell curve covers why score distributions take that shape in the first place.
This is also why the conversion is publisher-independent in principle. Pearson's WISC-V interpretive report states that the primary index scores and the Full Scale IQ "are on a standard score metric with a mean of 100 and an SD of 15." The adult battery, the WAIS-5, reports its index scores and Full Scale IQ the same way. Any test reporting on that metric converts to percentiles by the same curve, whether it measures reasoning, reading or arithmetic.
The standard score to percentile conversion table
These values come from the standard normal distribution, rounded to the nearest whole percentile. Scores between the listed anchors interpolate smoothly though unevenly, for reasons covered further down.
• Standard score 70 = 2nd percentile: two standard deviations below the mean, with 2.3 percent of the reference group scoring lower.
• Standard score 85 = 16th percentile: one standard deviation below the mean. The exact figure is 15.87 percent.
• Standard score 90 = 25th percentile: the bottom of the range most publishers describe as average. The exact figure is 25.25 percent.
• Standard score 100 = 50th percentile: the mean of the norm group, and the median of a normal distribution.
• Standard score 110 = 75th percentile: exactly 74.75 percent, so the familiar "top quarter" label is very slightly generous.
• Standard score 115 = 84th percentile: one standard deviation above the mean, 84.13 percent.
• Standard score 120 = 91st percentile: 90.88 percent, which rounds up rather than down.
• Standard score 130 = 98th percentile: two standard deviations above the mean, 97.73 percent.
• Standard score 145 = 99.9th percentile: three standard deviations above the mean, 99.865 percent. Roughly one person in 741.
Notice how compressed the middle is and how stretched the ends are. Between 100 and 110, ten score points buy about 25 percentile points. Between 130 and 145, fifteen score points buy just over two.
Clinicians attach descriptive labels to bands of this table, and those labels have varied between publishers. The American Academy of Clinical Neuropsychology published a consensus conference statement on uniform labeling of performance test scores in 2020, which indicates how much interpretive weight these ranges carry.
Doing the conversion from first principles
You do not need a published table. The conversion has two steps, and any spreadsheet will run it.
• Step one, find the z score: subtract 100 from the standard score and divide by 15. A standard score of 113 gives a "z score," the number of standard deviations a value sits from the mean, of (113 - 100) / 15 = 0.867.
• Step two, find the area below that z: apply the cumulative normal distribution. In a spreadsheet, `=NORM.S.DIST(0.867, TRUE)` returns 0.8069, so a standard score of 113 falls at the 81st percentile.
Running those steps against Pearson's published sample report is a useful check. It lists a Verbal Comprehension Index of 121 at the 92nd percentile, a Working Memory Index of 110 at the 75th, and a Full Scale IQ of 132 at the 98th. The normal curve gives 91.9, 74.8 and 98.4. Published table and theoretical curve agree to the rounded percentile.
They will not always agree that closely. Norms are empirical, built from a finite standardization sample whose score distribution is never perfectly normal, and publishers fit and smooth those distributions before printing a table. Work on continuous norming by Alexandra Lenhard and colleagues shows that real score distributions carry skewness, kurtosis and floor or ceiling effects a pure normal model cannot capture, and that different modeling choices shift the resulting norm scores. A printed table that puts 120 at the 90th rather than the 91st percentile is reporting the norm sample, not making an error.
A percentile rank is not a percentage, and not an equal-interval scale
Two misreadings account for most of the confusion, and both are worth stating plainly.
• It is not a percentage correct: a percentile rank of 92 does not mean 92 percent of the items were answered correctly. Pearson's report puts it directly: a percentile rank of 92 means the child "performed as well as or better than approximately 92% of children her age." The number describes standing in a group, and a test can be made harder or easier without moving it.
• It is not an equal-interval scale: five percentile points mean wildly different things depending on where you are on the curve. Moving from the 50th to the 55th percentile takes a standard-score gain of about 1.9 points. Moving from the 94th to the 99th takes about 11.6 points, roughly six times as much real change for the same five-point percentile step.
That second property has a practical consequence. Percentile ranks should not be averaged, subtracted or fed into statistics that assume equal intervals. Standard scores can be, which is why score differences are computed on the standard-score metric. For a fuller treatment of how percentiles behave across the range, see our article on IQ percentiles.
Your percentile is a band, not a point
Every observed score contains measurement error, so the percentile you read off the table is an estimate of where a person stands, not a fixed fact about them. The Standards note that the standard error of measurement can be used to generate confidence intervals around reported scores, and describe it as generally more informative than a reliability coefficient once score interpretation has become the user's main concern.
Test reports apply this directly. Pearson reports WISC-V composite scores with 95 percent confidence intervals, and in its sample report a Full Scale IQ of 132 carries an interval of 125 to 136. Converted to percentiles, that interval runs from the 95th to the 99th. The single number 98 is the midpoint of a range, and the honest reading is that the child's true standing is very likely somewhere in the top few percent.
The second boundary on interpretation is the norm group. A percentile is meaningless without the reference population attached to it. The Standards make the point with a clinical example, noting that norms based on hospitalized patients might be inappropriate for interpreting the scores of nonhospitalized patients, and that reference populations therefore need to be carefully defined and clearly described. The same raw performance can land at the 60th percentile against one population and the 40th against another. Our guide to norm groups explains what a defensible norm sample looks like, and confidence intervals covers the error band in more detail.
Norms also age. The Standards require publishers to renorm with sufficient frequency to permit continued accurate interpretation for as long as a test remains in print, because the usefulness of norms based on a given sample diminishes over time.
Getting a standard score worth converting
The conversion itself is the easy part. Its value depends on whether the standard score going in came from a properly normed instrument administered under standard conditions. A percentile derived from an unnormed online quiz carries the arithmetic of the normal curve and none of its meaning, because no defined reference population sits underneath it.
The Reasoning and Intelligence Online Test is a professionally developed IQ test built for adults 18 and over by RIOT IQ with psychometrician Dr. Russell T. Warne. It runs 15 subtests across six cognitive indices, takes about 52 minutes, and reports scores on the mean-100, standard-deviation-15 metric this article describes, with percentile ranks attached. It is not a substitute for an individually administered clinical evaluation.
Frequently asked questions
What percentile is a standard score of 115?
The 84th. A standard score of 115 sits exactly one standard deviation above the mean of 100, and 84.13 percent of a normal distribution falls below that point.
Does a percentile rank of 90 mean I answered 90 percent of questions correctly?
No. A percentile rank of 90 means you scored as well as or better than about 90 percent of the people in the test's norm group. It says nothing about how many items you got right.
Why do two publishers give slightly different percentiles for the same standard score?
Because norms are built from real standardization samples that are never perfectly normally distributed, and publishers smooth and model those distributions differently. Differences of a percentile point or two are normal and are not errors.
Can I average two percentile ranks?
No. Percentile ranks are ordinal and not equal-interval, so averaging them distorts the result. Average the standard scores instead, then convert the average to a percentile.
How do I convert a standard score to a percentile without a table?
Subtract 100, divide by 15 to get a z score, then apply the cumulative normal distribution to that z score. In most spreadsheets the function is NORM.S.DIST with the cumulative argument set to TRUE.
References
1. American Educational Research Association, American Psychological Association, & National Council on Measurement in Education. (2014). Standards for educational and psychological testing. AERA. testingstandards.net
5. Lenhard, A., Lenhard, W., & Gary, S. (2019). Continuous norming of psychometric tests: A simulation study of parametric and semi-parametric approaches. PLOS ONE, 14(9), e0222279. doi.org
6. Guilmette, T. J., Sweet, J. J., Hebben, N., Koltai, D., Mahone, E. M., Spiegler, B. J., Stucky, K., & Westerveld, M. (2020). American Academy of Clinical Neuropsychology consensus conference statement on uniform labeling of performance test scores. The Clinical Neuropsychologist, 34(3), 437-453. doi.org
Figure: original illustration created for RIOT IQ showing the standard-score distribution (mean 100, SD 15) and the percentile ranks that correspond to it. It is not a reproduction of any published test material.
Take our professional IQ test
Want to know your IQ? Try the first ever professional online IQ test.